EOCRC Exercise 3: Reproducing the Eight-Gene Survival Analysis in TCGA
1. What you will practice
Section titled “1. What you will practice”One row in a survival table represents one patient. It joins three types of columns.
| patient | ALDOB … WNT11 | time_days | event |
|---|---|---|---|
TCGA-XX-0001 | Eight-gene tumour expression | 1,240 | 1 |
TCGA-XX-0002 | Eight-gene tumour expression | 980 | 0 |
event=1 means death was observed during follow-up. event=0 means the patient was known to be alive at day 980, not that the patient survived indefinitely. Information stops at the last observation, making this a censored observation.
This exercise asks:
When tumour expression of eight genes is combined into one risk score, do the high- and low-score TCGA-COAD groups have different overall-survival curves?
2. Join expression and survival at the patient level
Section titled “2. Join expression and survival at the patient level”The paper used TCGA-COAD tumour expression and survival information from UCSC Xena. Current GDC releases and processing pipelines can differ. Fix the current source and preprocessing rather than forcing the paper’s p-value.
Step 1 prompt: prepare TCGA-COAD expression and survival
Add a tcga-survival analysis to the EOCRC exercise project.

1. Run uv add xenaPython lifelines and record Python, pandas, and lifelines versions.
2. In the current UCSC Xena GDC hub, verify TCGA-COAD.star_tpm.tsv and TCGA-COAD.survival.tsv. Record the hub URL, dataset names, and download date.
3. Query only ALDOB, FBXL16, IL1RN, MSLN, RAC3, SLC38A11, WNT11, and METTL27, the current name for WBSCR27. Label the output column WBSCR27 and record the alias mapping.
4. Use the first 12 characters of the sample barcode as the patient barcode and retain Primary Tumor sample type. For multiple tumour samples, select the lexicographically first barcode.
5. Use OS as event and OS.time as time_days from the survival dataset, recording those definitions in the manifest.
6. Exclude patients with non-positive or missing time or missing expression for any gene. Print exclusion counts at every step.
7. Save one row per patient with eight STAR-TPM expression columns, time_days, and event to outputs/tcga-coad-8gene-survival.csv.
8. Print tumour sample count, unique patient count, deaths, censored observations, and median follow-up.
9. Do not assume that the current GDC STAR-TPM/Xena snapshot and the paper's data share releases or preprocessing. Explain the difference and stop.
Do not mix RNA sample counts with patient counts. Survival is patient-level while expression is sample-level, so the analysis needs a deterministic one-tumour-sample-per-patient rule before the join.
3. Combine eight values with a Cox model
Section titled “3. Combine eight values with a Cox model”A Cox proportional hazards model assigns a coefficient to each gene. Patient i receives this score:
is standardized expression for gene j in patient i, and is the fitted Cox coefficient. A positive coefficient points toward higher hazard with higher expression when the other variables are held constant.
Step 2 prompt: Cox score and Kaplan-Meier curve
Use outputs/tcga-coad-8gene-survival.csv to add the eight-gene survival analysis.

1. Standardize each expression column to mean zero and standard deviation one. Save means and standard deviations to outputs/tcga-expression-scaling.csv.
2. Fit lifelines CoxPHFitter with time_days, event, and the eight genes.
3. Save coef, exp(coef), standard error, p-value, and 95% confidence interval to outputs/tcga-cox-coefficients.csv.
4. Check the proportional-hazards assumption and write any violations to outputs/tcga-ph-assumption.txt. Do not hide warnings.
5. Calculate each risk_score and classify scores at or above the median as High and those below as Low. Save outputs/tcga-risk-groups.csv.
6. Plot High and Low Kaplan-Meier curves with 95% confidence intervals and number at risk. Save outputs/tcga-8gene-km.png at 180 dpi.
7. Run a log-rank test and record its statistic and p-value.
8. The paper reported log-rank P=0.00013 for the overall CRC analysis. If the current value differs, report it unchanged. Do not remove patients or alter the threshold to match it.
9. State that coefficients were trained and curves evaluated in the same TCGA cohort, so this is not independent validation.
10. State that this does not directly validate EOCRC-specific prognosis, explain the result, and stop.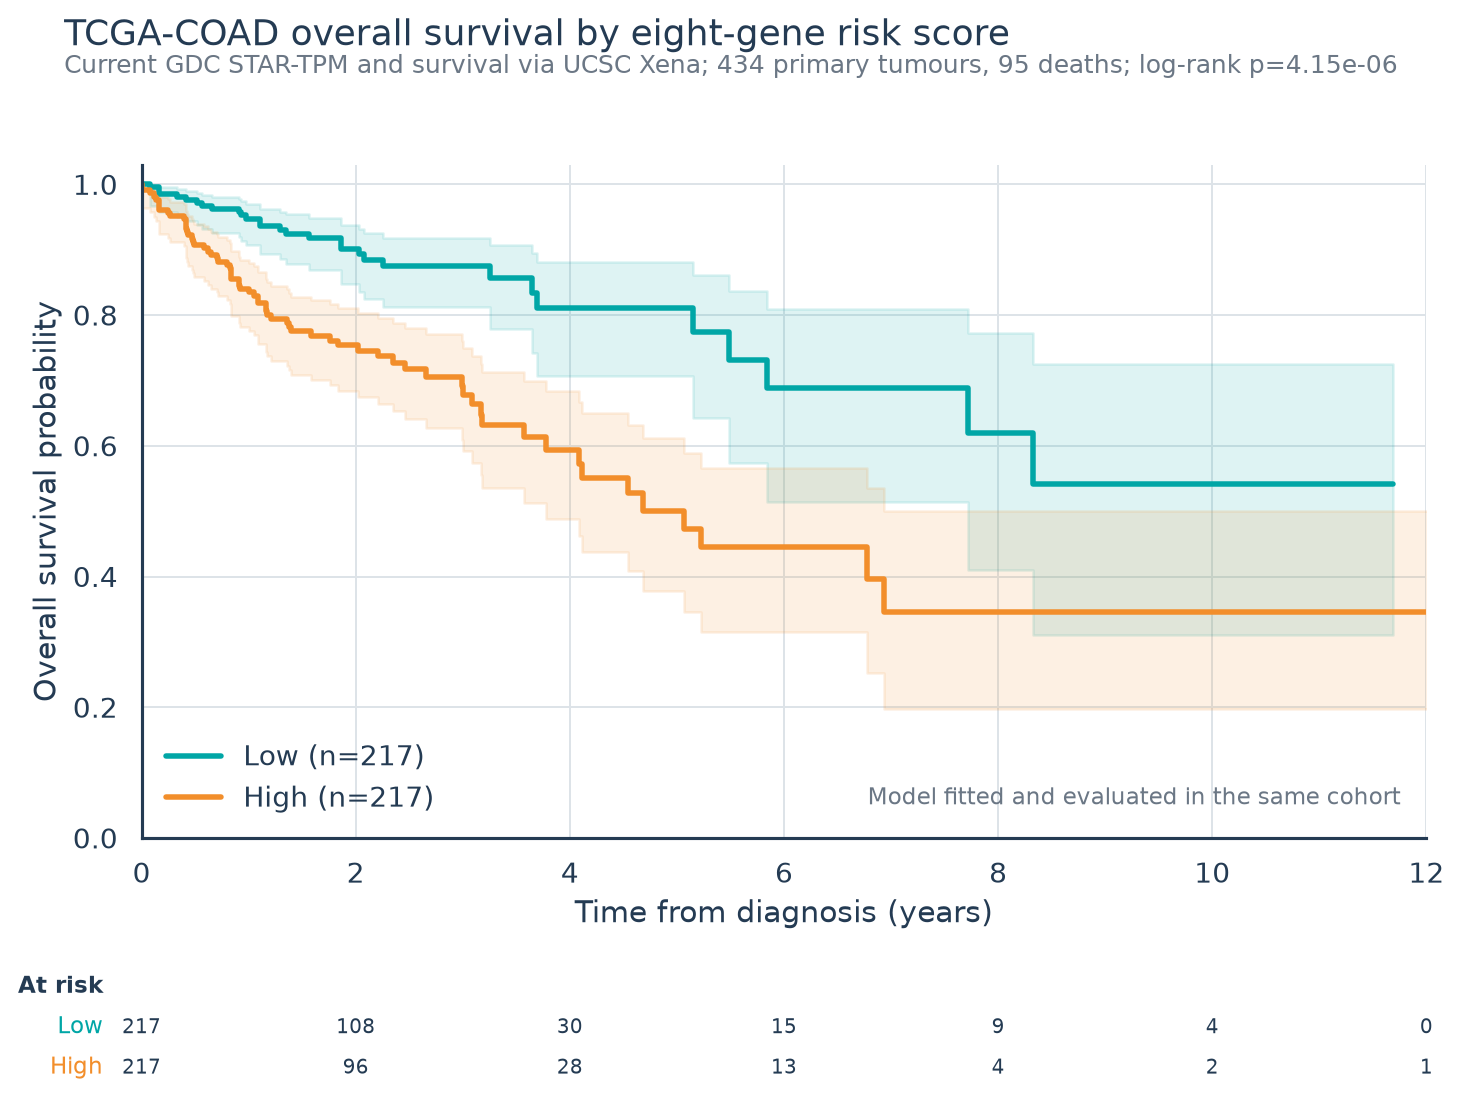
Actual run: current GDC STAR-TPM and UCSC Xena survival yielded 434 patients and 95 deaths. The same-cohort eight-gene model produced High and Low groups of 217 patients each with log-rank p=4.15 × 10⁻⁶. This differs from the paper’s 0.00013 because the data snapshot and preprocessing are not identical.
4. Read the Kaplan-Meier curve
Section titled “4. Read the Kaplan-Meier curve”The vertical axis estimates the probability of remaining alive without an observed event through each time. Fewer patients remain under observation toward the right edge, so an apparently large late separation may be based on only a few patients. Read the number-at-risk table with the curve.
A log-rank p-value tests whether the curves differ. It does not give an effect size or an individual’s survival probability. A Cox hazard ratio also does not directly predict the number of days a particular patient will survive.
5. Questions to answer
Section titled “5. Questions to answer”- What does
time_daysmean whenevent=0? - Why can joining sample barcodes directly to survival duplicate a patient?
- Why does a median score split not make the p-value an effect for an individual gene?
- Why is an all-TCGA-COAD result not EOCRC-specific prognosis?
- What bias arises when training and evaluating the model in the same patients?
The next EOCRC exercise changes the input from a gene-expression table to BAM and splice-junction evidence.
6. Sources and reproducibility
Section titled “6. Sources and reproducibility”Record the GDC release, API queries, sample-selection rule, survival-time definition, expression unit, standardization, lifelines version, Cox coefficients, and median threshold.