09. Measuring Pathway Activity in One Sample
Looking only for individual genes that stand out can miss which biological programs are working together in a tumor. By combining the expression ranks of several related genes, you can compare pathway activity even in a single sample.
Question for this lesson: Are the genes in a particular pathway highly expressed together in this sample?
The algorithm resembles checking whether a particular tag repeatedly appears near the top of search results. Sort genes by expression, scan from the top, and raise the score whenever a member of the target gene set appears.
ranked_genes = sort_by_expression(sample, descending=True)running_score = 0
for gene in ranked_genes:    running_score += hit_weight(gene) if gene in gene_set else miss_penalty
Real ssGSEA uses additional ranking, weighting, and normalization rules, but this captures the control flow: sort → membership test → cumulative score.
1. What you can analyze with one sample
Section titled “1. What you can analyze with one sample”Once you have an expression matrix, even one sample can reveal signals produced by groups of genes, beyond outlier detection.
- ssGSEA: Which biological programs (pathways) are active in this sample?
- Dimensionality reduction (UMAP): Which samples resemble this sample?
ssGSEA: how active is each pathway?
Section titled “ssGSEA: how active is each pathway?”ssGSEA (single-sample Gene Set Enrichment Analysis) assigns a score for how strongly genes associated with a particular pathway are collectively expressed within one sample. In the analysis, a pathway is represented as a gene set. For example, HP_OSTEOSARCOMA includes CDKN2A, TP53, MDM2, and members of the RPL and RPS families.
The shape of the data changes as well.
gene × sample expression matrix + pathway gene sets → pathway × sample score matrix
One column containing tens of thousands of genes is summarized into hundreds or thousands of pathway scores. This compression hides which individual genes drove a score, and pathways that share genes can have dependent scores.
The calculation uses a rank-based cumulative score.
- Rank every gene in the sample from highest to lowest expression.
- Move down the ranking one gene at a time. Increase the score if the gene belongs to the target pathway, and decrease it otherwise.
- Use the point where this cumulative score reaches its greatest separation as the enrichment score.
In other words, the score is higher when many pathway genes cluster near the top of the expression ranking. In R, it can be calculated with the GSVA package.
Unlike ssGSEA, standard GSEA tests a condition contrast across multiple samples. You can run it in the complete-gene-ranking stage of the GSE251845 exercise. Both walk a ranking with a cumulative score, but their inputs and questions differ.
library(GSVA)gsva_param <- ssgseaParam( exprData = combined_mat, # gene x sample expression matrix geneSets = gene_sets, # gene sets for each pathway alpha = 0.25, normalize = TRUE)ssgsea_scores <- gsva(gsva_param)If you include reference cohorts such as GTEx (normal) and EBI/PCAWG (cancer), you can see where your sample’s pathway activity falls relative to normal tissues and other cancers.
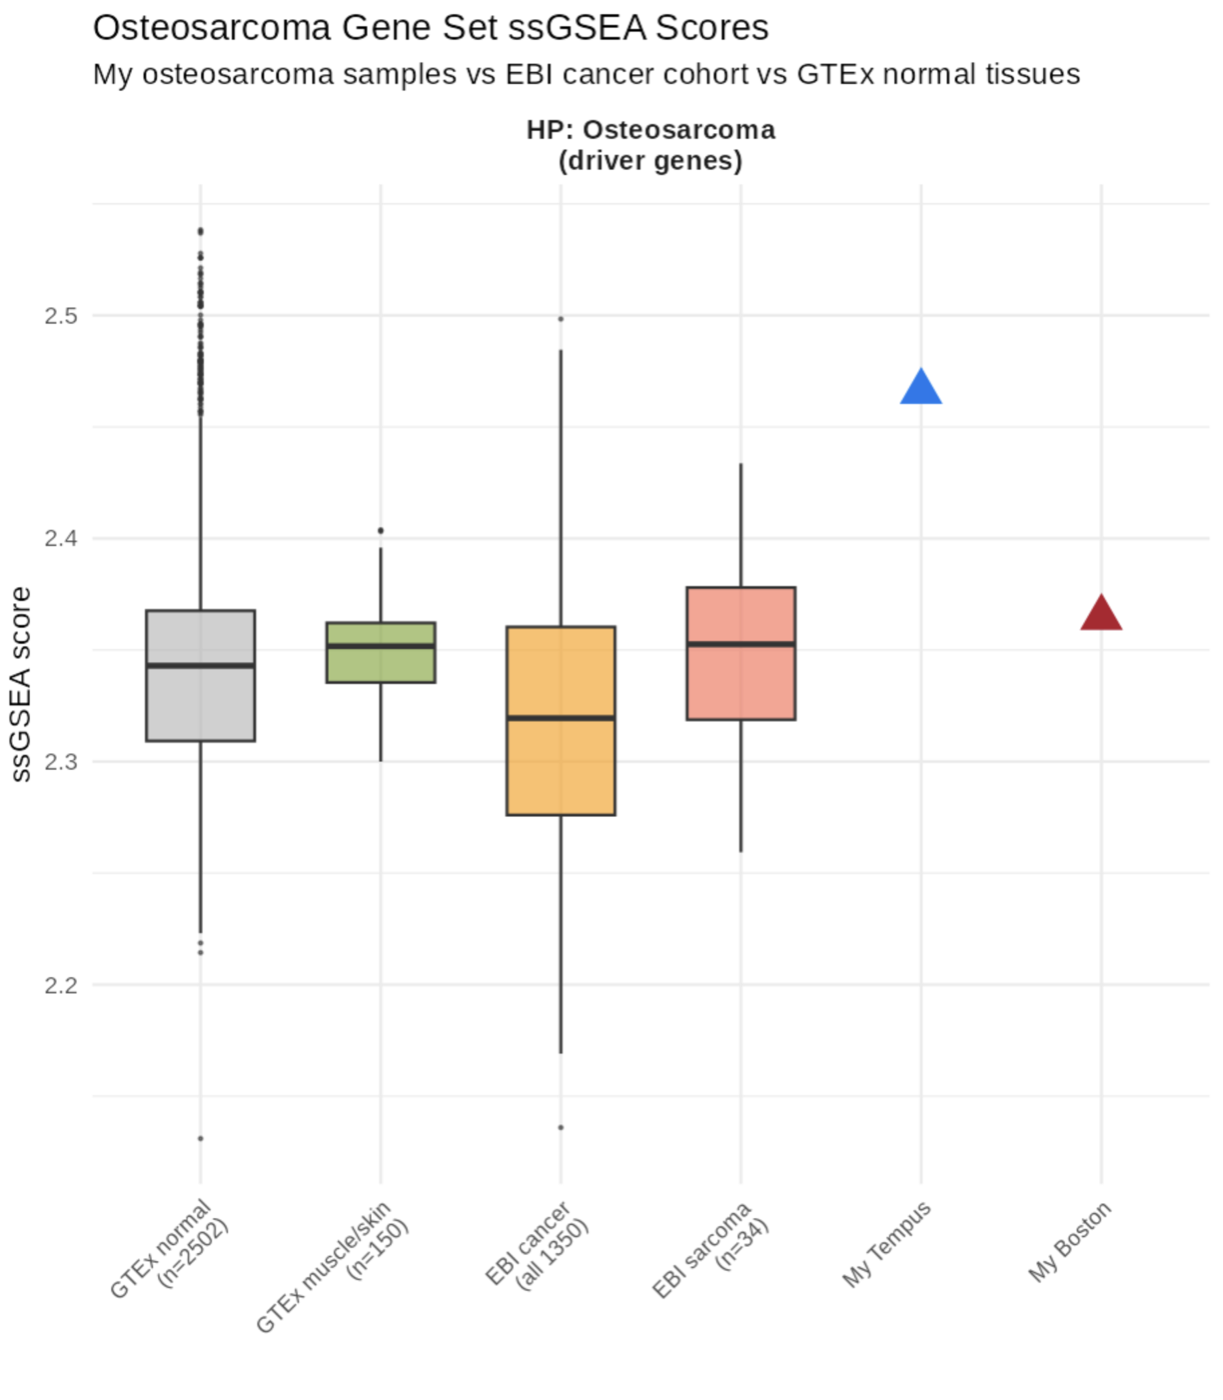
Distribution of ssGSEA scores for the HP_OSTEOSARCOMA gene set. My tumor samples, My Tempus and My Boston, are shown as triangles above box plots for the GTEx normal and muscle tissues and the EBI cancer cohort. Their higher positions indicate that the osteosarcoma-related program is relatively more active.
Summary
Section titled “Summary”ssGSEA ranks the genes in one sample by expression, then scores whether genes from a particular pathway cluster near the top.
Gene-level expression ranks + pathway gene set → cumulative rank score → pathway activity for each sample
The score is not an absolute active or inactive classification. Interpret its relative position within score distributions from normal tissues and other cancers calculated with the same method.
Next, Finding samples with similar expression examines which cancer and tissue samples have the closest genome-wide expression patterns.