Case: Sid Sijbrandij, the founder who investigated his own cancer
This case is the reason HomeGenomics began. Its subject is Sytse “Sid” Sijbrandij, co-founder of the developer collaboration platform GitLab. After being diagnosed with a rare cancer at age 45, he studied his data in depth, assembled a team of physicians and scientists, and reviewed possible treatments. Then he made the process public.
“It became my own job to keep myself alive. Nobody else was going to do it for me at this point.”
This one case contains many of the data types covered in this handbook. Through one person’s actual record, we examine what RNA sequencing is, why single-cell data matters, and how a signal from data undergoes further validation before becoming a treatment candidate.
1. What happened: diagnosis and a dead end
Section titled “1. What happened: diagnosis and a dead end”On November 10, 2022, at age 45, Sid discovered a 6 cm mass at his fifth thoracic vertebra, T5. The diagnosis was osteosarcoma.
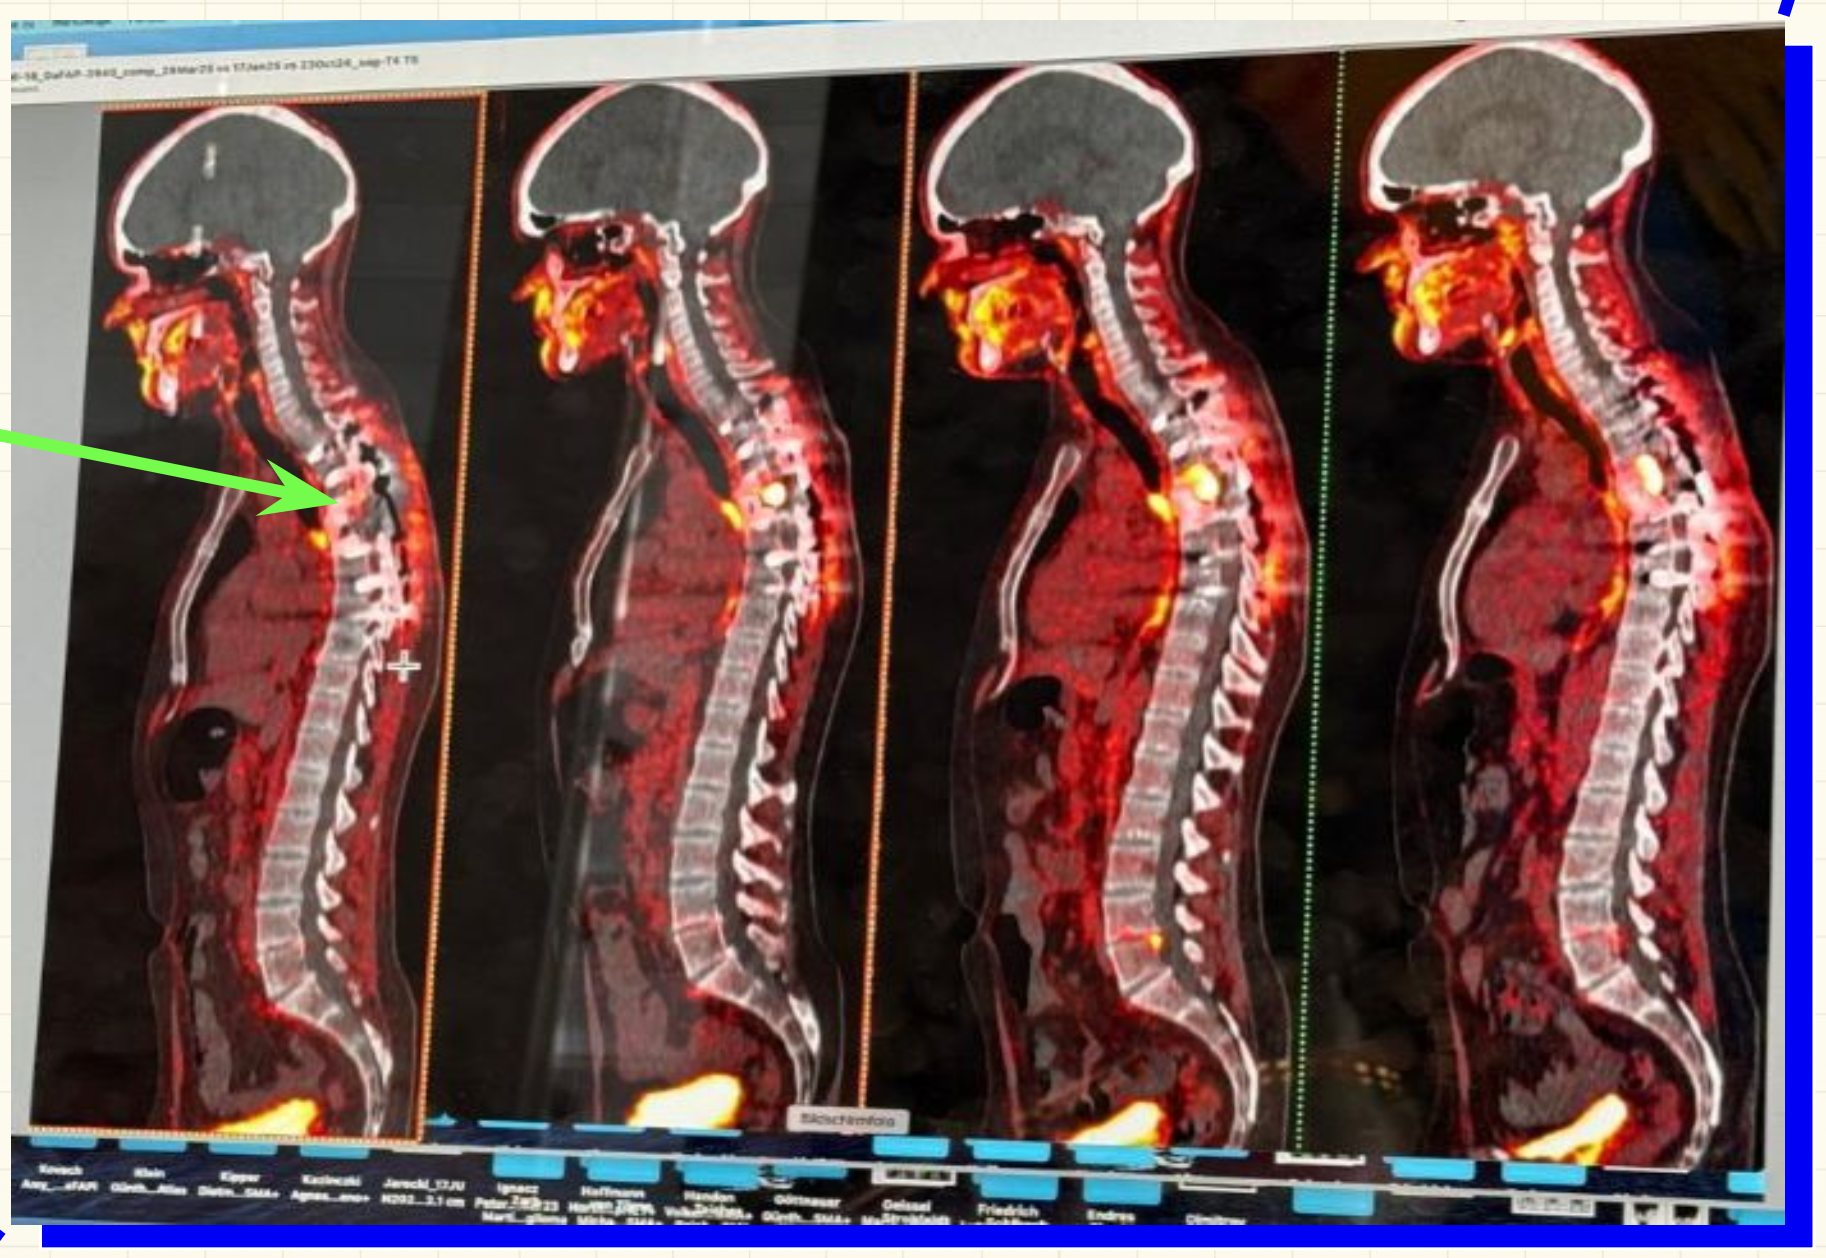
PET/CT images tracking the spinal tumor over time.
🧩 What is osteosarcoma? “Osteo,” bone, + “sarcoma” equals a cancer of bone. It is a rare cancer that occurs mainly in children and adolescents, making its appearance in a healthy middle-aged adult highly unusual.
At first, he acted as most patients do: he delegated to experts.
“When I was first diagnosed with cancer in 2022, I delegated the crucial analyses and decisions about my care to others.”
Treatment began conventionally, in the standard-of-care phase from 2022 to 2024.
- Surgery, December 2022: removed the T4/T5 vertebrae containing the cancer and stabilized the site with titanium
- Radiation, January to February 2023: stereotactic body radiation therapy, SBRT, to the thoracic spine, precisely directing radiation at the tumor
- Chemotherapy, February to June 2023: four cycles of cisplatin + doxorubicin, followed by two cycles of doxorubicin + ifosfamide. He required four blood transfusions and described it as “devastating”
The combination produced remission for a time. In 2024, however, the cancer returned. This is where the usual patient journey hit a wall.
“In late 2024, when my cancer reappeared and my doctors told me I had exhausted the standard of care and there were no trials for my situation, I realized that assumption might, quite literally, kill me.”
💡 In a developer’s language: the bug remained after every documented solution had been tried. Sid did not leave his existing physicians. He chose to bring in more specialists and examine other possibilities together.
2. The difference in risk tolerance Sid perceived
Section titled “2. The difference in risk tolerance Sid perceived”After being told that standard care and suitable clinical trials were exhausted, Sid felt a gap between the risk he was willing to accept and the risk the medical system would allow. He described this as physicians and patients having different “incentives.”
“In my case, because it’s a nasty cancer with medieval medicine, I’d rather die from a treatment than from the cancer. … That is not what you will get with doctors. They have very different incentives than you.”
This statement is Sid’s perspective on his experience at the time. Physicians’ goals cannot be generalized as merely minimizing legal liability. Clinicians also consider survival, quality of life, and patient preference, but evidence for judging expected benefits and harms is limited when a treatment’s effectiveness and safety are unproven. Different patients can accept different levels of risk in the same situation. The important response is not to exclude clinicians, but to discuss uncertainty and risk tolerance explicitly and add the required expertise.
This leads to the next section, “Founder Mode.”
3. “Founder Mode”: act like a founder, not only a patient
Section titled “3. “Founder Mode”: act like a founder, not only a patient”Sid decided to manage his care like a startup project. He called it “Managing my health in Founder Mode.”
“Founder Mode meant going deep on every diagnostic and treatment option.”
The philosophy he used to build GitLab formed the foundation.
“One of the core principles of the first company I founded, GitLab, was radical transparency, and it’s a principle I am bringing to my cancer care.”
After the 2024 recurrence, he set four principles.
- Maximal Diagnostics Use every available diagnostic technology to characterize the tumor as precisely as possible. Acquire the data even when it cannot immediately determine a treatment.
- Making Treatments Design personalized treatments from the tumor-analysis results, reviewing targeted therapy, vaccines, cell therapies, and other options.
- Treatments in Parallel Prepare and review several treatment candidates at the same time to save time.
- Open-source & Scale Publish diagnostic data and the treatment process so other patients can use the same approach. By 2025, his compiled “Sid Health Notes” exceeded 1,000 pages.
💡 The familiar developer pattern is measurement → hypothesis → review → documentation and release. Clinical treatment, however, is not a set of independent A/B tests. When treatments overlap, separating which treatment caused an effect or side effect becomes difficult.
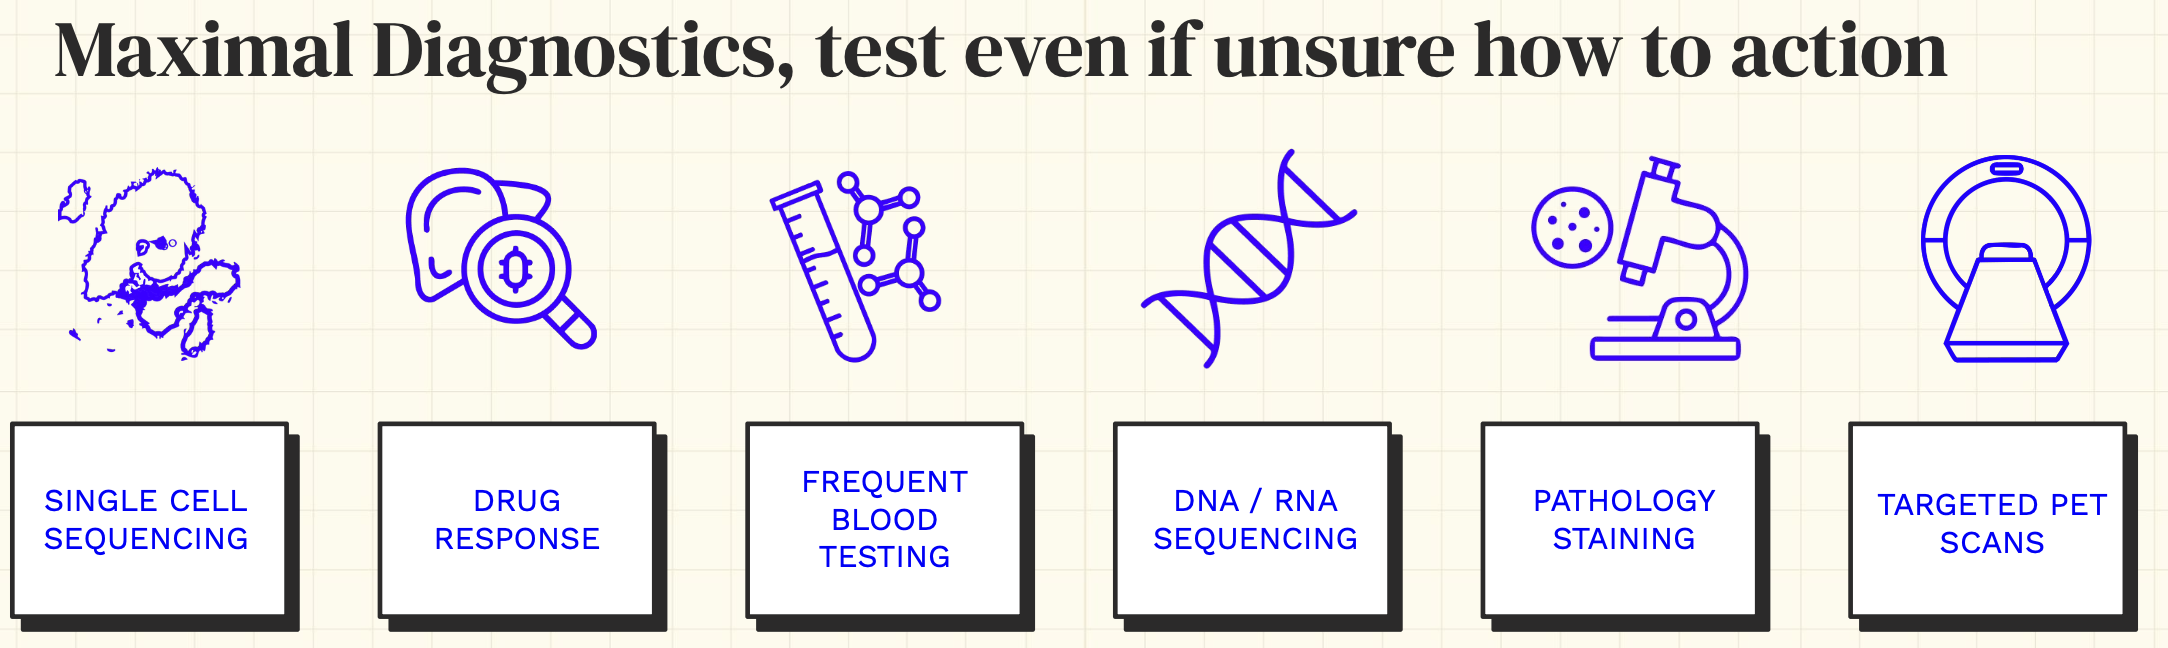
“Maximal Diagnostics”: even without an immediate treatment decision, run every available diagnostic first and acquire the data.
He produced an enormous dataset and published about 25 TB of it online.
4. The heart of the case: use data to narrow treatment candidates
Section titled “4. The heart of the case: use data to narrow treatment candidates”Sid’s surgery, radiation, and chemotherapy began with standard clinical judgment. In the personalized treatments attempted later, sequencing data became important evidence for finding targets to attack in the tumor. Sequencing was not the only evidence. The team also reviewed pathology staining, imaging, drug response, and existing clinical evidence.
The pattern we will learn is: find a signal in data → validate it another way → evaluate treatment candidates and risks.
🧩 What is sequencing? It is a technology for reading the sequence of DNA or RNA “letters” inside cells. For a developer, it resembles collecting system logs. DNA is the blueprint, or source code; RNA is the code currently running, or runtime logs. Read RNA to see what a cancer cell is doing now, and DNA to see which variants are embedded in it.
Tracking change with data
Section titled “Tracking change with data”Start with an observed number. Sid’s team analyzed tumors from different time points using single-cell sequencing and found:
- At recurrence: T cells1 made up 19% of infiltrating immune cells
- After surgery during the parallel immunotherapy period: T cells made up 89%
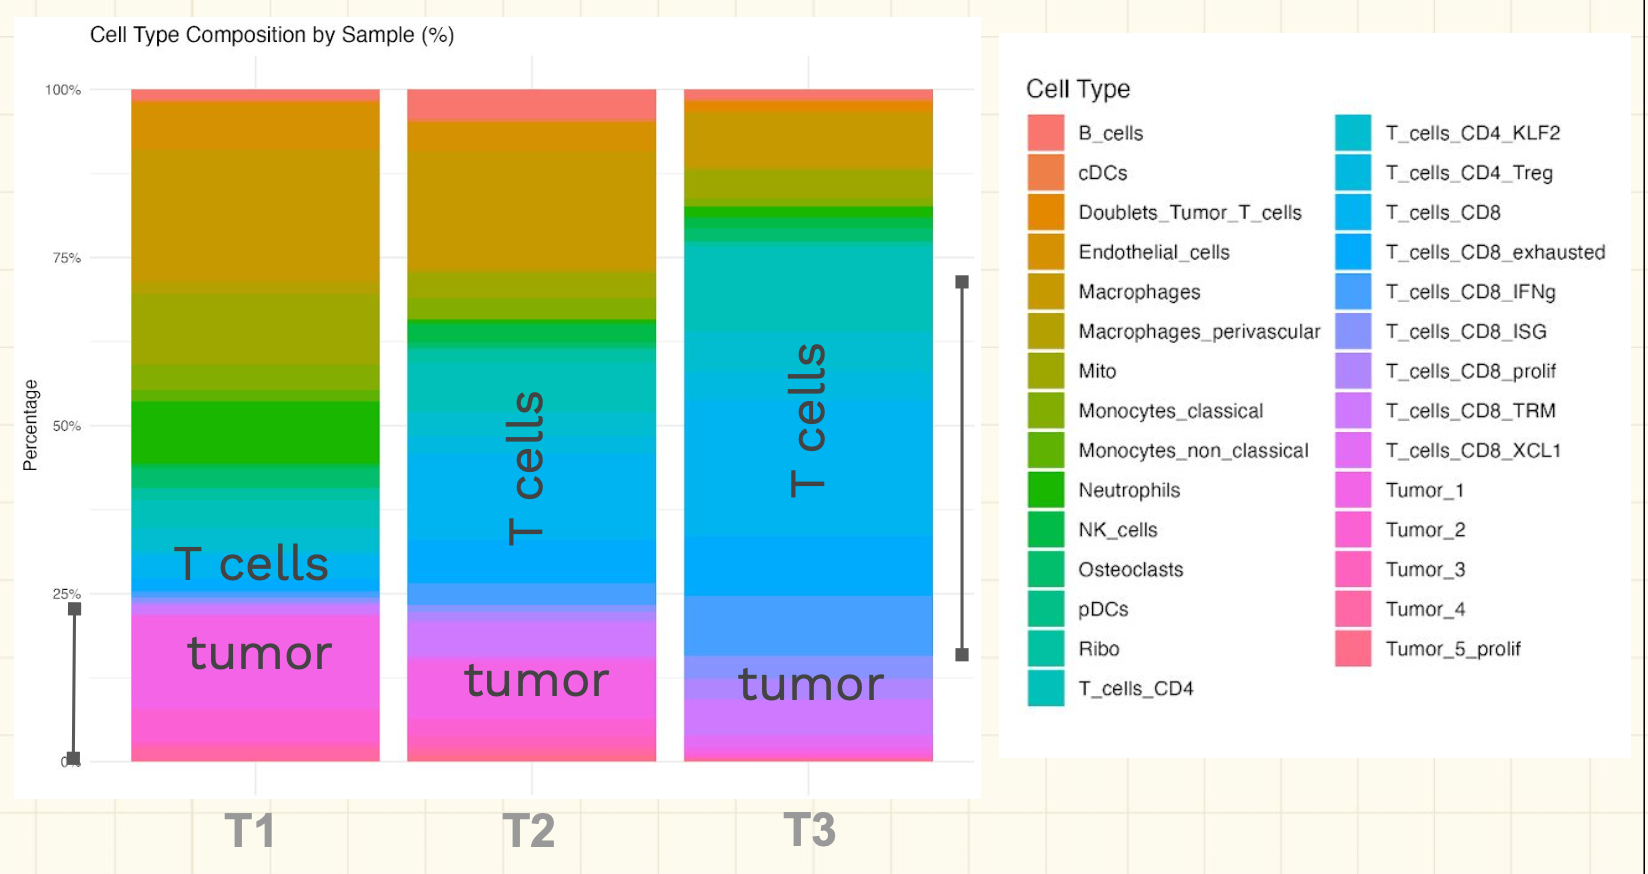
Cellular composition in the tumor at different time points. The data show a large increase in the proportion of immune T cells.
The numbers show that the immune-cell composition observed in the tumor changed substantially between the two time points. But proportions also change when other cells in the denominator increase or decrease. Because several treatments occurred in between, these numbers alone cannot prove which treatment caused the change. Sequencing measures change precisely and creates the next question.
Mapping six treatments to their core data
Section titled “Mapping six treatments to their core data”The key is which data each treatment began from.
| # | Treatment | Core data → target |
|---|---|---|
| 1 | Radioligand therapy | Single-cell sequencing + targeted radiodiagnostics → FAP2 |
| 2 | Personalized mRNA vaccine | Single-cell + DNA/RNA sequencing → neoantigens3 |
| 3 | Personalized TCR-T | Single-cell sequencing → TCRs from tumor-reactive T cells4 |
| 4 | Functional screening | Drug-response testing + frequent MRD5 tests → existing drugs that work |
| 5 | MDM2-targeted therapy | Drug response + DNA/RNA sequencing → overexpressed MDM26 |
| 6 | CAR-T program | Single-cell + DNA/RNA + pathology staining7 + radiodiagnostics → surface clean target8 |
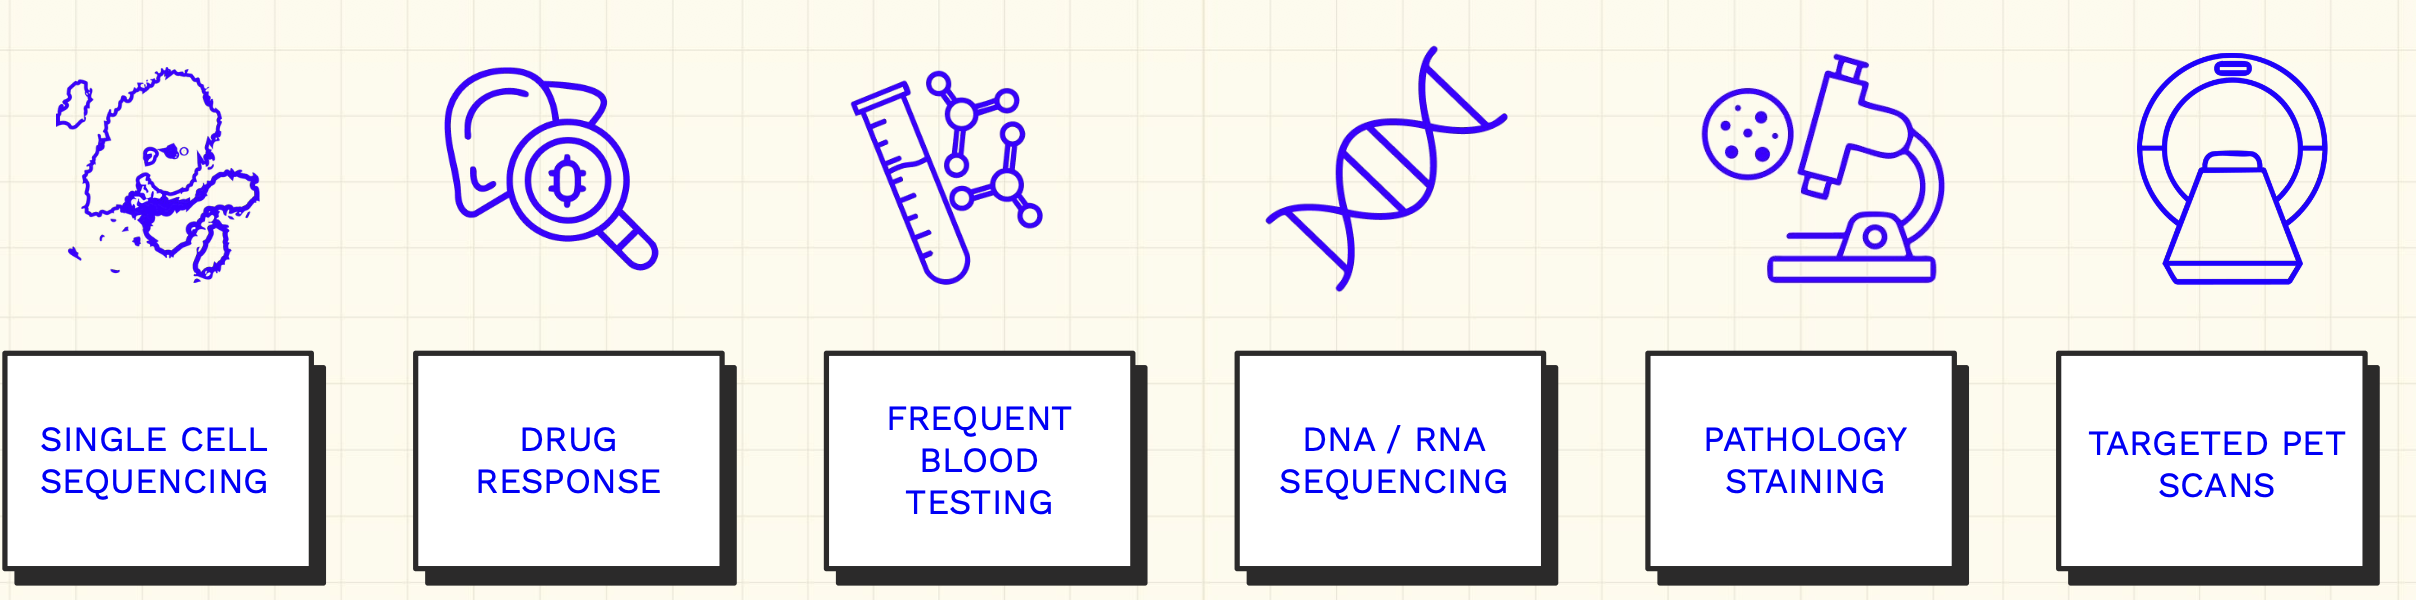
At a glance, the data source from which each of the six treatment branches began.
Now consider what each branch means.
1. Radioligand therapy: track response with imaging
Section titled “1. Radioligand therapy: track response with imaging”First, single-cell sequencing detected tumor cells. Integrated analysis with normal tissue found genes expressed unusually strongly only in cancer, or DEGs, genes with large expression differences. The selected target was FAP.
🧩 What is single-cell sequencing? Conventional bulk sequencing grinds up the whole tissue and measures an average. Single-cell sequencing reads expression in each captured cell separately. It resembles inspecting a log for each request instead of only the overall average response time, revealing which cell population produced a signal.
🧩 DEG (Differentially Expressed Gene): a gene whose expression differs greatly between cancer and normal tissue. It is like selecting a log line that stands out from a normal build.
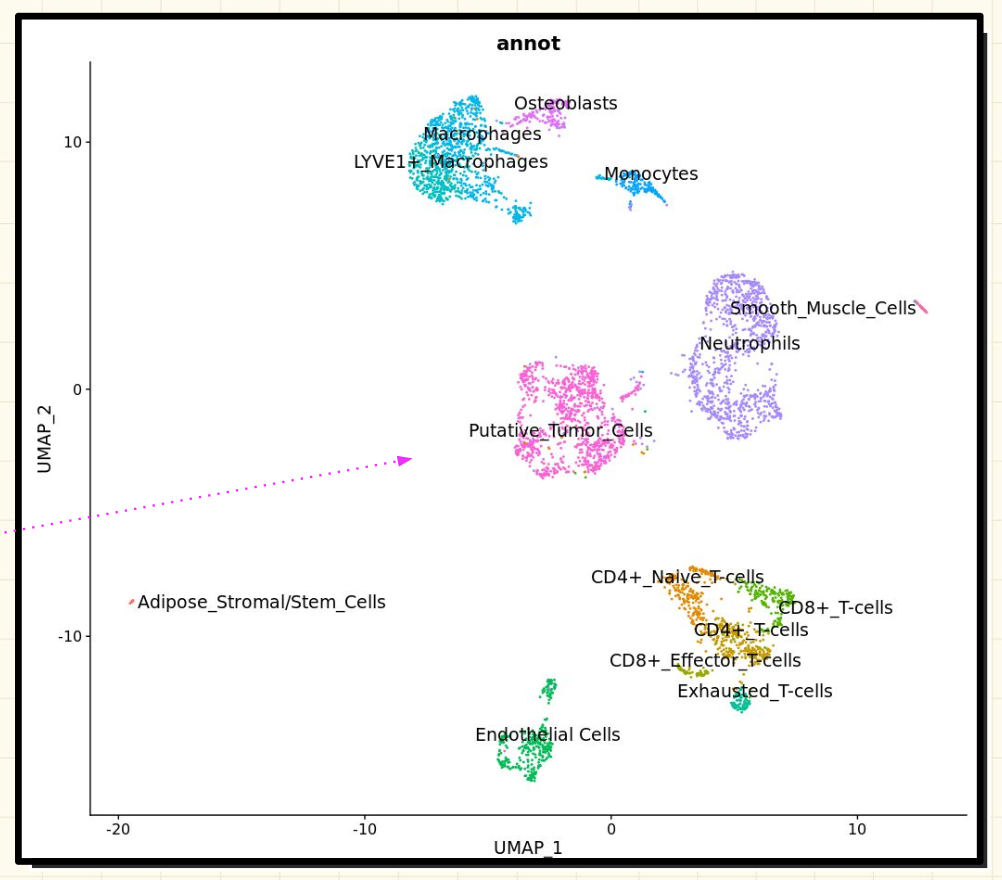
Single-cell data separate cell clusters so a gene expressed unusually strongly in cancer, FAP, can be selected as a target.
FAP can be abundant not only in cancer itself but also in cancer-associated fibroblasts (CAFs) around a tumor. Attaching a radioisotope, lutetium-177, to a molecule that binds FAP can concentrate radiation in FAP-rich areas. Sid’s public record reports that lesion signals on PET imaging decreased after treatment at CURANOSTICUM in Germany. This is one patient’s imaging response. Separate validation is required to determine how much each mechanism contributed and whether other patients would have the same response.
2. Personalized mRNA vaccine: give the immune system a wanted poster
Section titled “2. Personalized mRNA vaccine: give the immune system a wanted poster”DNA sequencing of tumor tissue detects variants and identifies target genes. RNA sequencing then checks how strongly those variants are actually expressed to select vaccine candidates. Safety validation, vaccine design and manufacture, administration, and outcome monitoring follow.
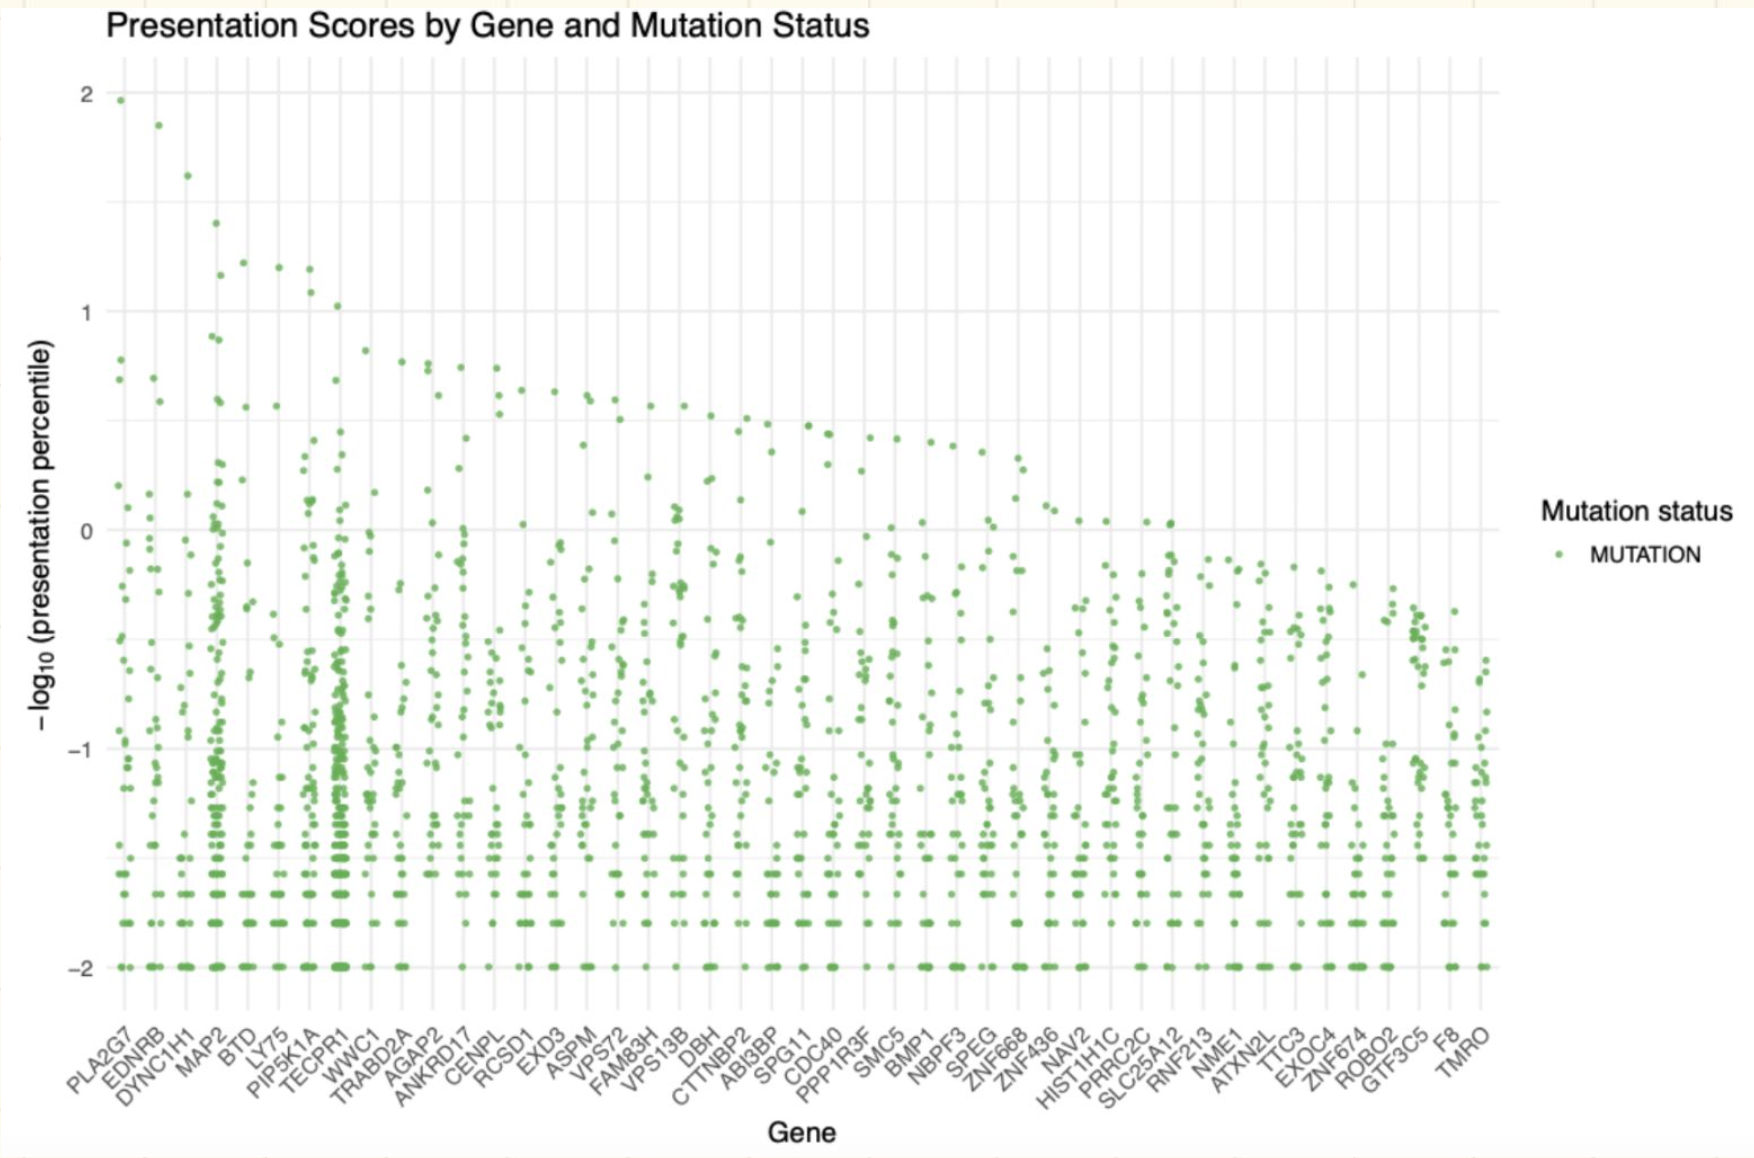
Among many variant candidates, only those that are actually expressed and highly immunogenic advance as vaccine candidates.
🧩 What is a neoantigen? It is a mutated protein found only in cancer cells. Because normal cells do not have it, it can act as a wanted poster telling immune cells which face to capture. An mRNA vaccine delivers that poster to immune cells, using the same basic principle as COVID-19 vaccines.
3. Personalized TCR-T: copy effective immune cells
Section titled “3. Personalized TCR-T: copy effective immune cells”Single-cell sequencing observes cancer-targeting T cells inside the tumor. The team identifies tumor-reactive T-cell clones and watches whether they are actually proliferating, or expanding. After evaluating several TCR candidates, it chooses one, transfers that receptor, the TCR, into healthy T cells, and returns them to the body.
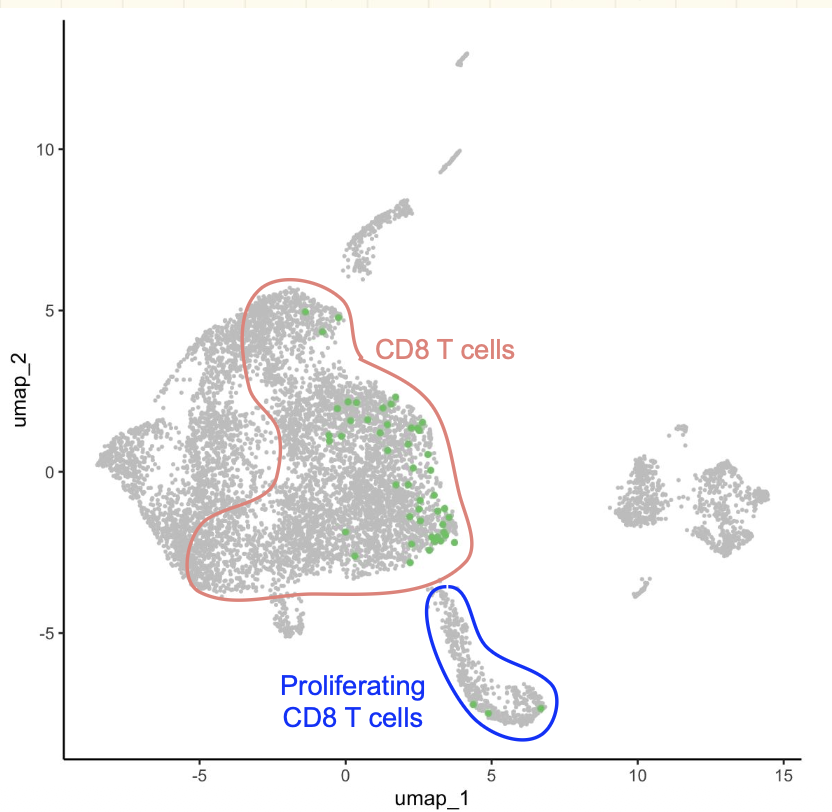
Single-cell data reveal T-cell clones that are actively proliferating while fighting cancer.
💡 As an analogy: find the soldier fighting most effectively in the field, copy the weapon blueprint, the TCR, equip many healthy soldiers with it, and deploy them.
4. Functional screening: try the available options
Section titled “4. Functional screening: try the available options”The patient’s living cancer cells are grown in the laboratory as an organoid, a small organ model. Existing drugs are tested directly for response, and those with better responses receive higher priority. Frequent MRD tests track the effect.
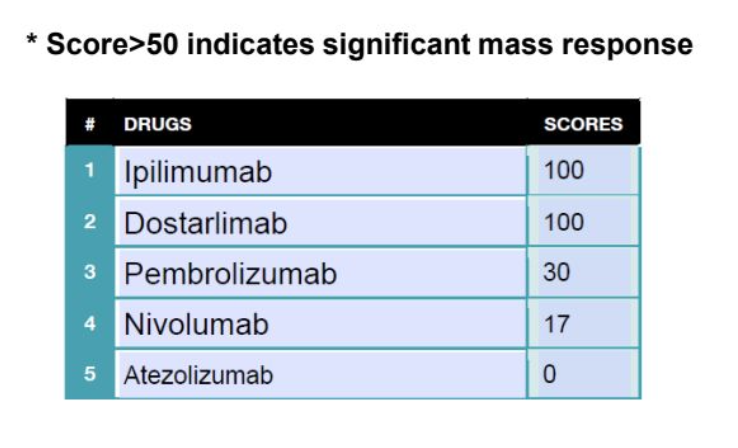
Apply existing drugs directly to patient cells and prioritize those with high response scores, illustrated here as an example.
🧩 What is an organoid? It is a miniature organ model grown from patient cells. Think of it as a sandbox or staging environment that lets you test a drug on a stand-in for the patient before using it in a real person.
5. MDM2-targeted therapy: data revives a discontinued drug
Section titled “5. MDM2-targeted therapy: data revives a discontinued drug”RNA sequencing identified MDM2 as a target with unusually high expression. Comparison with large cancer datasets provided evidence for reviewing it as a treatment candidate. A drug candidate targeting this gene had already been developed, so Sid’s team reevaluated it using his molecular data and existing research.
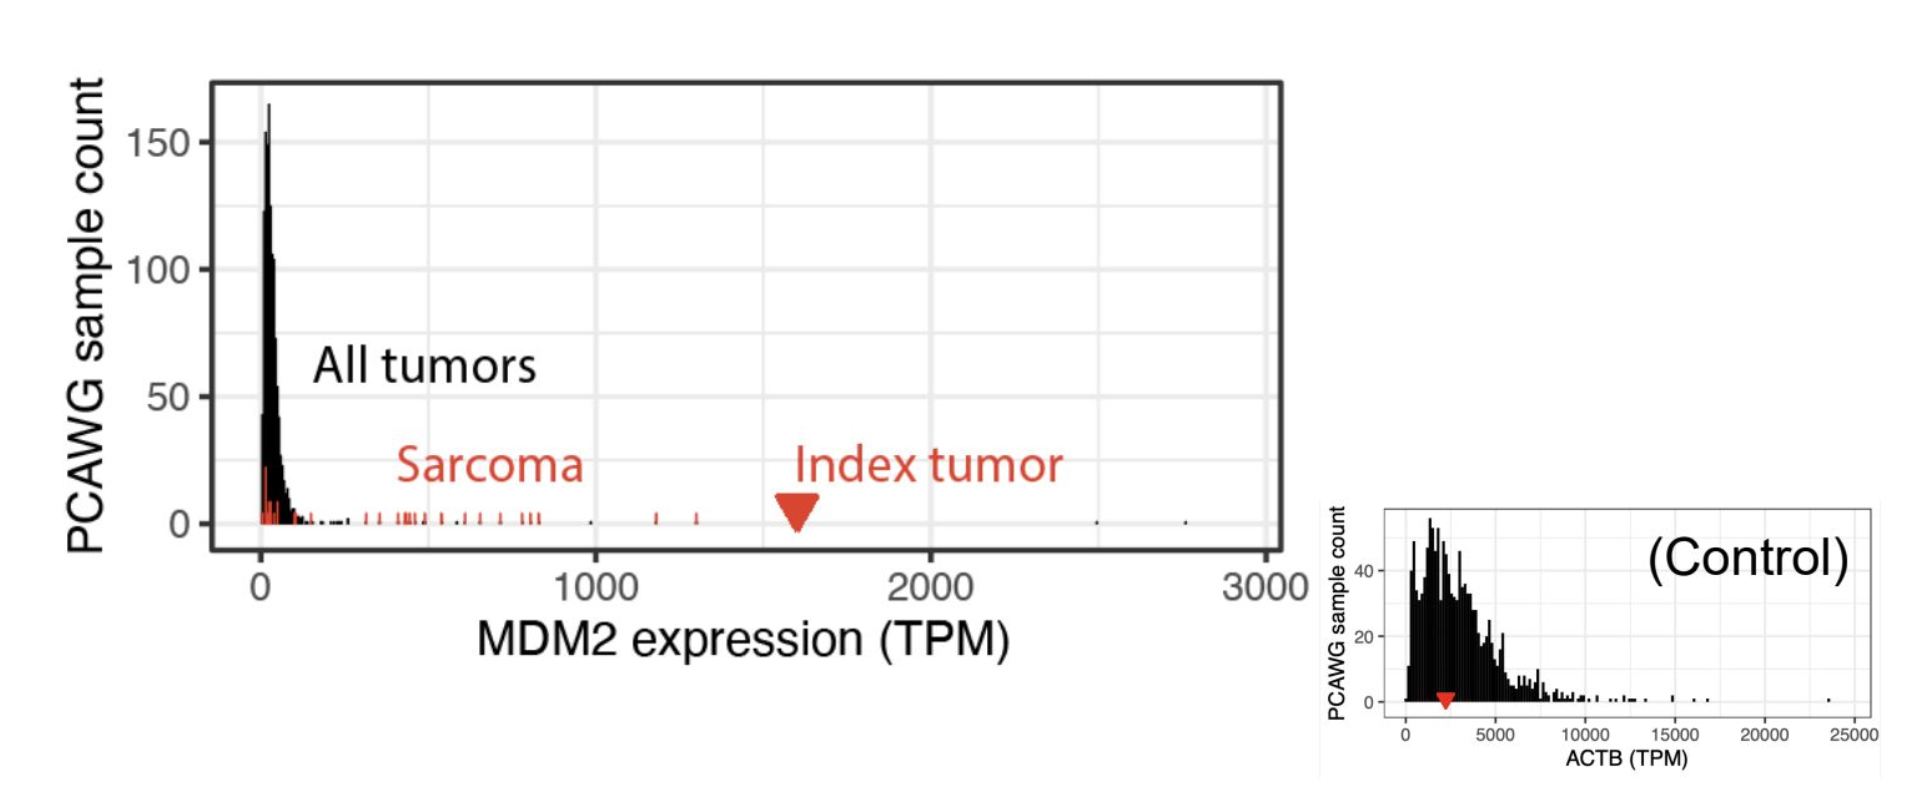
MDM2 expression is unusually high relative to controls. This one-line signal became a target.
💡 Expression level is the key clue. The same gene can be switched on to different degrees. This is why the handbook begins with bulk RNA-seq, which measures expression.
6. CAR-T program: the wrong target can be dangerous
Section titled “6. CAR-T program: the wrong target can be dangerous”CAR-T is an immune-cell therapy similar to TCR-T in section 3, but a CAR is an engineered receptor that directly recognizes proteins exposed on the cancer-cell surface.
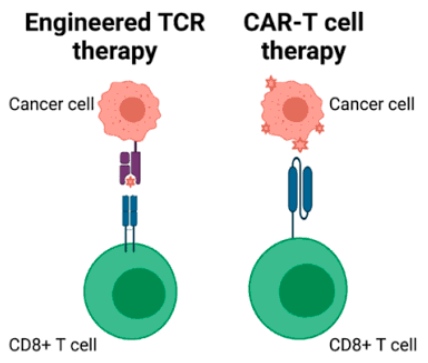
TCR-T can recognize intracellular antigens, while CAR-T recognizes proteins on the cell surface.
🧩 TCR versus CAR in one line: a TCR can recognize antigens from inside a cell, while a CAR directly recognizes only proteins on the cell surface. CAR is simpler and more powerful, but a wrong target can make it attack normal cells, so target selection is critical.
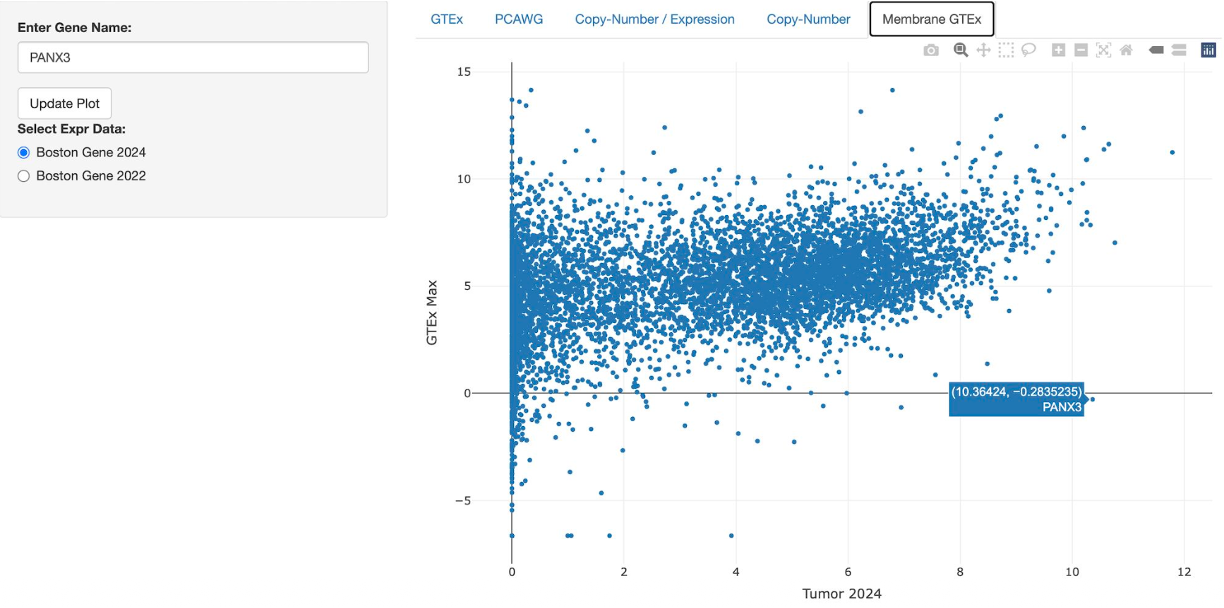
Expression from RNA sequencing and imaging initially pointed to B7-H39, but imaging analysis revealed a risk to the liver. The team therefore repeated target selection using a systems-biology approach, such as the experimental SNIPR system, and moved the program toward a cleaner target expressed more strongly in tumor than normal tissue, such as PANX3. This is a good example of data revealing a risk early enough to change direction.
Whole-body imaging checks in advance whether a target candidate is also expressed in normal organs such as the liver, revealing risk through data.
5. People, not systems, were the bottleneck
Section titled “5. People, not systems, were the bottleneck”More striking than the technology was that Sid had to fight even to access data from his own body. He described an “incredible struggle at every hospital” to retrieve his tissue samples and even deployed “forward deployed tissue extractors” to release stored tissue.
His description of the cost contradiction is especially sharp.
“It costs $1B to get a drug approved. But it costs $1M to dose a single person.”
“The FDA wants me to live.”
He defines his role not as someone who invents treatments, but as someone who clears blocked paths.
“I increasingly see my role as removing structural barriers: breaking down walls that prevent data, treatments, and technologies from flowing where they’re needed.”
“I’m the Kool-Aid Man breaking through the wall.”
The Kool-Aid Man is a US advertising character famous for entering by breaking through a wall.
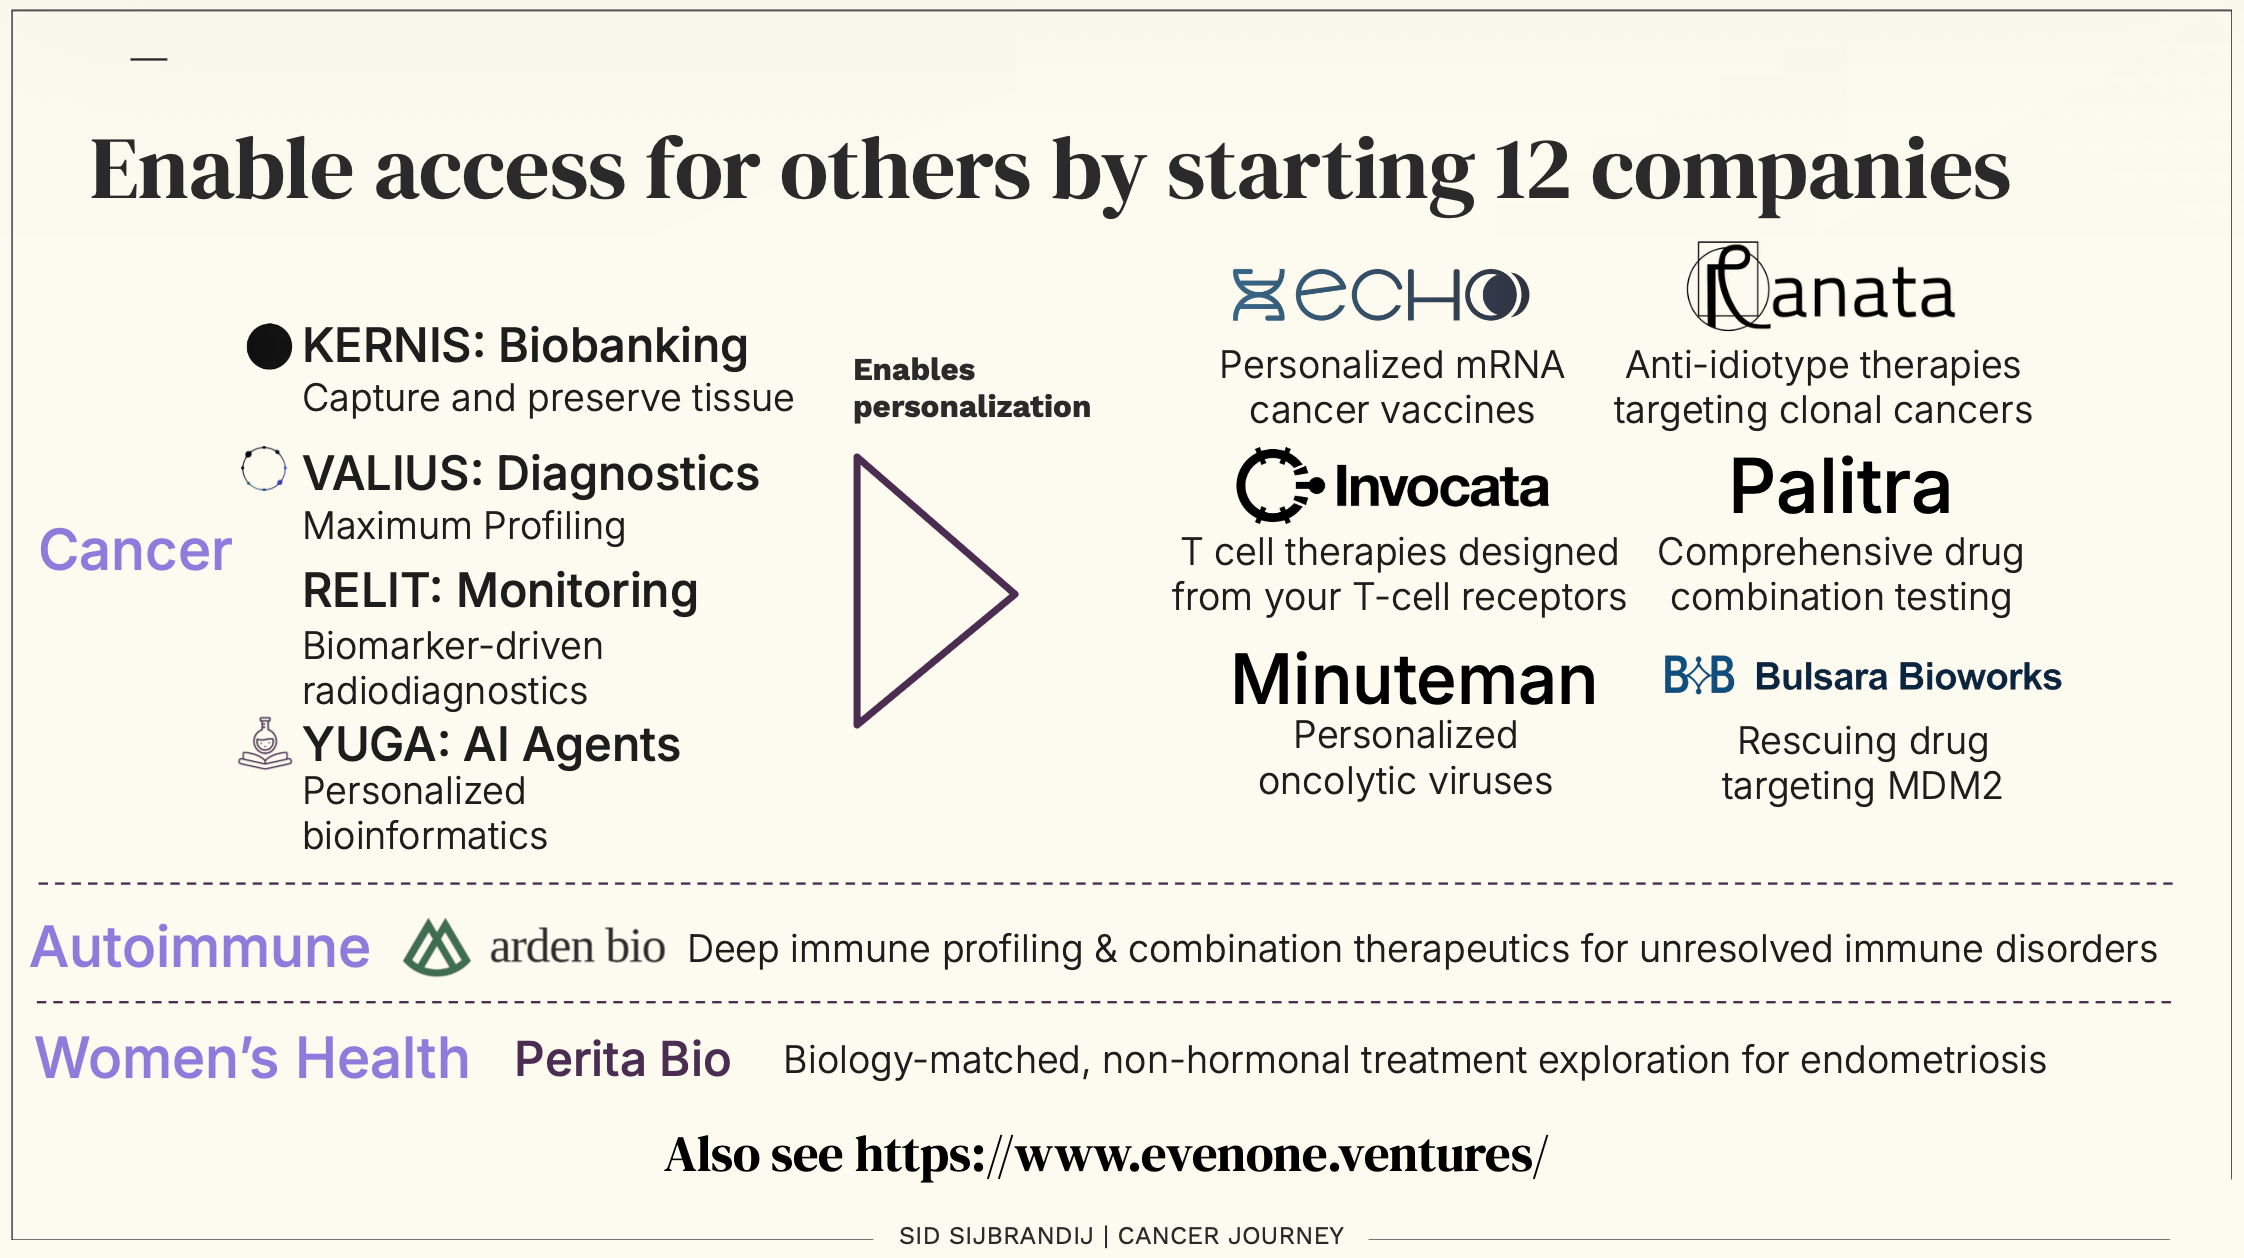
To clear blocked paths, he created several companies and projects intended to let data, treatments, and technologies flow.
6. His current status
Section titled “6. His current status”In a post published in June 2026, Sid said that imaging had shown no evidence of disease, NED, for about one year.
“Today, thanks to the efforts of many people around the world and the support of my wife Karen, I currently have no evidence of disease.”
This is not the same as being declared cured. No disease is visible, but continued monitoring is necessary. His care team’s motto after remission is “Stay Paranoid.” If signs of recurrence appear, the plan is to respond in stages based on MRD levels.
🧩 What is MRD, minimal residual disease? It detects very small traces of cancer invisible on imaging through tumor DNA in blood or similar measurements. It resembles monitoring a tiny error that remains in the logs even when it is not visible on screen.
He stepped down from GitLab CEO to Executive Chair to focus on treatment. At the same time, he started a new software company, Kilo Code, and became involved in ventures helping patients in similar situations. In his words: “I’ll talk to anyone, I’ll go anywhere, and I can be there anytime.”
7. Why does this matter to us?
Section titled “7. Why does this matter to us?”Commentator Elliot Hershberg interprets Sid’s case as an early signal of what future cancer treatment might make possible. He predicts that a consumer-centered oncology platform could eventually connect screening through treatment. This is the commentator’s forecast, not a currently validated treatment model or cost estimate.
Sid’s resources are not those of an average person. What his story truly demonstrates, however, is a flow, not money. The most important point to take from this case is:
Interpreting a tumor requires normal data for comparison. In DNA analysis, a normal sample such as blood can be collected at diagnosis to exclude germline variants. In RNA analysis, adjacent normal tissue can be compared with tumor, although it may be affected by the tumor environment, so external references such as GTEx are also used.
Creating personal sequencing data while healthy is therefore not a prerequisite for cancer analysis. Biopsying healthy tissue in advance is also impractical. Historical personal data may help track long-term change, but it is not a perfect baseline for comparing a future tumor.
8. What do we learn first?
Section titled “8. What do we learn first?”Sequencing and other diagnostic data played an important role in narrowing Sid’s personalized treatment candidates, so we also begin with the data. We move gradually from the most intuitive, not from whatever seems hardest. The handbook follows this sequence.
- Bulk RNA-seq, available now: read how strongly a gene is switched on, its expression. Sid’s MDM2 case belongs here.
- Single-cell RNA-seq, available now: distinguish individual cells. This underlies the change in T-cell proportion and the search for FAP and TCR candidates.
- Whole-exome sequencing (WES) and whole-genome sequencing (WGS), planned next: read variants in protein-coding regions and across the whole genome.
For each data type, we cover (1) data overview, definition and production → (2) main analysis flow → (3) interpretation and connection to decisions, then connect it to the corresponding treatment in Sid’s case. Alongside the concepts are individual exercises that open and inspect the data directly.
Sources and further reading
Section titled “Sources and further reading”- Sid Sijbrandij, “I’m going Founder Mode on my cancer”: his own account
- Sid Sijbrandij, “Assembling Your Own Tumor Board”: specialist-team formation and June 2026 status update
- sytse.com/cancer, osteosarc.com/timeline, and the data manifest: about 25 TB of public data and the treatment timeline
- github.com/broomva/founder-mode-cancer: repository documenting the process
- Elliot Hershberg, “Going Founder Mode on Cancer”, Century of Bio: commentary and source of many quotations
- Korean summary on WikiDocs
Footnotes
Section titled “Footnotes”-
T cell: a key white blood cell in the immune system. It patrols the body, recognizes cells that are infected or have become cancerous, and kills them directly, like a continuously running security process. The T comes from the thymus, the organ where these cells mature. The proportion of T cells inside a tumor is a clue to its immune microenvironment, but an increased proportion alone cannot establish a treatment effect. ↩
-
FAP (Fibroblast Activation Protein): a protein abundant in cancer-associated fibroblasts, CAFs, in many tumors. Molecules that bind FAP are studied as targeted carriers for imaging or radioligands. FAP can also appear in normal tissue, so it must not be assumed to select tumors exclusively. See section 1. ↩
-
Neoantigen: a mutated protein fragment found only in cancer cells. Because normal cells do not contain it, it can serve as a wanted poster telling immune cells which face to capture. See section 2. ↩
-
TCR (T Cell Receptor): the recognition antenna through which a T cell identifies a target. After finding T cells that recognize cancer effectively, researchers can copy only their TCR, the recognition rule, transfer it into healthy T cells, and administer many of them. See section 3. ↩
-
MRD (Minimal Residual Disease): very small traces of cancer that are invisible on imaging but detectable through tumor DNA in blood or similar measurements. It resembles monitoring a tiny error that remains in the logs even when it is not visible. ↩
-
MDM2: a gene that suppresses and eliminates p53, a central tumor-suppressor “brake” protein in the cell. When MDM2 is overexpressed, the brake remains released and cancer can grow. In Sid’s case, its expression was an RNA-seq outlier and became a target. See section 5. ↩
-
Pathology staining: a test that colors a tissue section so the locations of cells and proteins become visible under a microscope. Staining with an antibody that binds only a particular protein, immunostaining, maps where and how much of that target exists in the tumor. ↩
-
Clean target: a target with little or no expression in normal tissue and prominent expression only in tumor. A target must be this “clean” for treatment to strike cancer while sparing normal cells. See section 6. ↩
-
B7-H3 (CD276): a protein commonly found on the surface of many cancer cells and a popular immunotherapy target, including for CAR-T. Its presence in some normal tissue is a problem. In Sid’s case, imaging detected expression in the liver, a risk signal, so it failed to qualify as the earlier “clean target.” ↩