FastQC: Read Quality Inspection
QC (quality control) is the analytical stage that checks the condition of reads stored in FASTQ. FastQC is software that performs these checks and produces an HTML report. Before alignment, it diagnoses whether the reads are usable and where they need attention.
Its place in the pipeline:
Obtain FASTQ → [① QC (FastQC)] → ② trimming → ③ alignment → ④ quantification (TPM) → ⑤ comparisonIntroducing the FastQC software
Section titled “Introducing the FastQC software”| Field | Details |
|---|---|
| Development | The Babraham Institute in the United Kingdom, specifically Babraham Bioinformatics; principal author Simon Andrews |
| Licence | GPL v3: open source, free to use, modify, and redistribute |
| Language | Java, cross-platform across macOS, Linux, and Windows |
| Interfaces | Both GUI, click-based, and CLI, command-line |
| Input | FASTQ with multiple encodings, as well as aligned SAM/BAM |
| Source | github.com/s-andrews/FastQC · distribution page |
Open-source operation and repository
Section titled “Open-source operation and repository”- Repository and source: github.com/s-andrews/FastQC, licensed under GPL v3, with the bundled JHDF5 library under Apache-2.0. Compiled executables for Windows, macOS, and Linux are available from the Babraham distribution page, while the source is on GitHub. It is also widely distributed through Bioconda and Linux distribution packages.
- Operating model: rather than a large foundation, this is a core-facility tool from an academic institution, Babraham, and is effectively a small project led by a single main maintainer, Simon Andrews. With approximately 193 commits, the latest release v0.12.1 (2023-03), and several dozen open issues and pull requests, activity is gradual but ongoing. Contributions are accepted through GitHub issues and pull requests.
- In other words, it is less a project “run by a vast community” than a tool created and released for free by one institute, then adopted as a standard by the community.
Technology stack
Section titled “Technology stack”| Component | Details |
|---|---|
| Primary language | Java 81.6%, for core logic and GUI. Report templates are HTML 16.1%; execution wrappers are Perl 1%, Python 1%, and Shell 0.2%; report-transformation XSLT is 0.1% |
| GUI | Java Swing, a click-based desktop application |
| Build | Apache Ant (build.xml) |
| Core libraries | HTSJDK (htsjdk.jar) for reading SAM/BAM; Apache Commons Compress/IO for compressed inputs such as gzip and bzip2; JHDF5 (cisd-jhdf5.jar) for HDF5 in Nanopore FAST5 |
- Because it is Java, it works the same way anywhere with a JVM. Bundling HTSJDK lets it open not only FASTQ but also BAM directly.
How does it work?
Section titled “How does it work?”- It streams through the file once, accumulating several statistics at the same time. It needs no reference genome, and its light computation usually finishes in minutes.
- It neither creates nor changes data. Quality scores on the fourth line of FASTQ are assigned when the sequencer calls bases. FastQC only reads and summarizes them.
- For measures such as duplication and overrepresented sequences, where retaining everything would be impossible, it estimates from a sample of the first observed sequences to save memory.
What FastQC reads: dissecting one FASTQ read
Section titled “What FastQC reads: dissecting one FASTQ read”The raw material summarized by FastQC is one read in FASTQ, which occupies four lines. An actual read looks like this:
@DRR024878.1 HWI-ST1290:260:C5GAPACXX:4:1101:2723:1997/1 ← ① ID and instrument coordinatesNGTCAGGTGGTCACCCATCTTCTTGATAAGCTTCACTTCCTCATCTAGGAAG... ← ② base sequence+ ← ③ separator#1:DDFFEHHDHHIJJJJJJJJJJHIJJJJJJJEIIJJJJJJIJJJJFJHHJG... ← ④ quality scores- ① ID line, beginning with
@: read number plus instrument, flow cell, lane, tile, and coordinates. See From Library to FASTQ for coordinate meanings. - ② Base sequence: the A, T, G, and C actually read. The initial
Nmeans a failed call, where the base could not be determined. - ③ Separator: marks the end of the sequence and the beginning of quality scores.
- ④ Quality scores: the same length as line ②, with one character representing the confidence in each base.
What does the Phred quality score mean?
Section titled “What does the Phred quality score mean?”The values in line ④ are Phred quality scores (Q), a logarithmic representation of the probability that a base is wrong. The sequencer assigns and writes them during base calling. FastQC does not create them; it only reads and summarizes them.
Q = -10 × log₁₀(P) (P = probability of a calling error)| Q | Error probability | Accuracy |
|---|---|---|
| 10 | 1/10 | 90% |
| 20 | 1/100 | 99%, a minimum baseline |
| 30 | 1/1,000 | 99.9%, a common passing level |
| 40 | 1/10,000 | 99.99% |
How is it stored as a character? Phred+33
Section titled “How is it stored as a character? Phred+33”To match one base to one character, Q values such as 2, 16, and 41 are encoded as ASCII characters using Phred+33.
character = ASCII( Q + 33 ) ⇄ Q = ASCII value(character) − 33For example, decoding the beginning of the read above gives:
| Position | Base | Quality character | Q | Interpretation |
|---|---|---|---|---|
| 1 | N | # | 2 | Failed call, so the base is N |
| 2 | G | 1 | 16 | Still low |
| 3 | T | : | 25 | Rising |
| 4 | C | D | 35 | Good |
This is a typical pattern: the first one or two bases have low quality, followed by stabilization at Q35 or higher, because the first cycles have unstable signal. FastQC’s Per base sequence quality graph collects these positional Q values across all reads and displays them as box plots.
⚠️ Older Illumina data sometimes used Phred+64. Most modern data uses Phred+33, shown as
Sanger / Illumina 1.9under FastQC’s Basic Statistics, and the tool detects the encoding automatically.
Outputs
Section titled “Outputs”Each file produces two outputs.
*_fastqc.html: a human-readable report with graphs and traffic lights.*_fastqc.zip: machine-readable source data, includingsummary.txtwith pass/warn/fail for each item,fastqc_data.txtwith numerical values, and graph images. It is used for automation and aggregation by MultiQC.
Meaning of the pass/warn/fail traffic lights
Section titled “Meaning of the pass/warn/fail traffic lights”Each item has built-in thresholds for warnings and failures, detailed below. These criteria assume genomic DNA, so normal RNA-seq can appear red, as explained later. Thresholds can also be adjusted through limits.txt.
Why run QC first?
Section titled “Why run QC first?”Garbage in, garbage out. If poor-quality reads are aligned unchanged, they may align incorrectly or fail to align, destabilizing every downstream result. QC has two purposes.
- Diagnose the data: did sequencing work, and are there anomalies?
- Provide evidence for the next stage, trimming: are adapters present? Does quality decline at the read end? What and how much should be removed?
QC summarizes the fourth-line FASTQ Phred scores across all reads as graphs. See the Data Formats Reference for the FASTQ format and quality scores.
Tool: FastQC
Section titled “Tool: FastQC”FastQC is the standard QC tool. Given read files, it produces an HTML report whose modules are labelled with green pass, yellow warn, or red fail traffic lights.
fastqc sample_1.fastq.gz sample_2.fastq.gz# → creates sample_1_fastqc.html and sample_2_fastqc.html- It reads
.gzdirectly, with no decompression required. - FastQC does not change the data. It preserves the original FASTQ and creates only a diagnostic report. Actual cutting happens in the next stage, trimming.
- For paired-end data, inspect
_1and_2separately. FastQC does not know the pairing relationship, so it creates two reports.
How to read the key items
Section titled “How to read the key items”The modules are easier to understand when grouped under four questions.
① Can each base be trusted? Quality
Section titled “① Can each base be trusted? Quality”- Per base sequence quality: quality by position. The key is whether it declines toward the end of the read, which informs end trimming.
- Per sequence quality scores: mean quality by read. A concentration at Q30 or above is good.
- Per base N content: proportion of failed calls, N. Concentration at a position suggests an instrument problem.
② Is anything mixed in? Contamination and artifacts
Section titled “② Is anything mixed in? Contamination and artifacts”- Adapter content: amount of adapter sequence. A rise supports adapter trimming.
- Overrepresented sequences: abundant sequences, which can indicate adapter or rRNA contamination.
③ Is sequence composition normal? Composition
Section titled “③ Is sequence composition normal? Composition”- Per base sequence content: A, T, G, and C proportions by position.
- Per sequence GC content: GC-content distribution. An unusual peak can suggest contamination.
④ Is structure normal? Distributions
Section titled “④ Is structure normal? Distributions”- Sequence length distribution: distribution of read lengths.
- Sequence duplication levels: duplication of identical reads.
The modules most often used to make direct processing decisions are Per base quality, which shows whether end quality declines, and Adapter content, which shows whether adapters remain.
Module details
Section titled “Module details”These are the major modules in FastQC v0.12. For each module, this section summarizes what it measures and which values trigger WARN or FAIL. Thresholds are approximate defaults and can be adjusted with limits.txt.
Basic Statistics
Section titled “Basic Statistics”File summary: total read count, read length, GC%, and encoding, for example Sanger/Illumina 1.9 means Phred+33. It is effectively always PASS and is used to check encoding and length.
Per base sequence quality
Section titled “Per base sequence quality”A box plot of the quality-score distribution at each position, or cycle. Quality normally declines toward the end because of sequencing characteristics.
- WARN: lower quartile below 10 or median below 25 at any position. FAIL: lower quartile below 5 or median below 20.
- A sharp decline at the end is evidence for end-quality trimming.
Per tile sequence quality
Section titled “Per tile sequence quality”Quality variation among tiles, or sections, of the flow cell. If only one tile is poor, that section may have had a physical problem such as a bubble or dust. See From Library to FASTQ for flow-cell and tile concepts.
- WARN: any tile is at least 2 below the positional mean. FAIL: at least 5 below.
Per sequence quality scores
Section titled “Per sequence quality scores”Distribution of mean quality by read. Most reads should concentrate at high Q, at least 27 to 30. A separate low-quality peak indicates a population of generally poor reads.
- WARN: modal mean quality below 27, an error rate of 0.2%. FAIL: below 20, an error rate of 1%.
Per base sequence content
Section titled “Per base sequence content”The A, T, G, and C proportions at each position. In theory they should be flat and independent of position.
- WARN: A-T or G-C difference above 10% at any position. FAIL: above 20%.
- ⚠️ In RNA-seq, the first approximately 10 bp are skewed and this module almost always FAILS. This can be normal, as explained below.
Per sequence GC content
Section titled “Per sequence GC content”Whether the GC% distribution across reads follows the organism’s characteristic normal distribution. Unexpected peaks can signal contamination from another organism, adapters, or rRNA.
- WARN: more than 15% of reads differ from the theoretical distribution. FAIL: more than 30%.
Per base N content
Section titled “Per base N content”The proportion of N, or failed calls, at each position. Normal is close to 0. A sharp rise at a particular position suggests an equipment or chemistry problem.
- WARN: N above 5% at any position. FAIL: above 20%.
Sequence Length Distribution
Section titled “Sequence Length Distribution”The read-length distribution. Before trimming, it is usually uniform, for example 100 bp.
- WARN: lengths vary. FAIL: a zero-length read exists.
- ⚠️ After trimming, varied lengths and a WARN are normal.
Sequence Duplication Levels
Section titled “Sequence Duplication Levels”How often identical sequences are duplicated, estimated from a sample of the first observed sequences.
- WARN: non-unique, duplicated reads above 20%. FAIL: above 50%.
- ⚠️ In RNA-seq, highly expressed genes produce many identical reads, so high duplication can be normal.
Overrepresented sequences
Section titled “Overrepresented sequences”A list of specific sequences that account for more than a given fraction of all reads, with estimated sources. This module can detect adapters, rRNA, and polyA tails.
- WARN: any sequence above 0.1%. FAIL: above 1%.
Adapter Content
Section titled “Adapter Content”The cumulative content by position of known adapter sequences, including Illumina Universal, Nextera, small RNA, and polyA/G.
- WARN: any adapter above 5% at any position. FAIL: above 10%.
- A rising curve is direct evidence for adapter trimming.
Note: the Kmer Content module from older versions has been disabled by default since v0.11.
⚠️ Cases where FAIL can be normal in RNA-seq
Section titled “⚠️ Cases where FAIL can be normal in RNA-seq”FastQC was originally designed with genomic DNA in mind, so some modules appear red despite normal RNA-seq. Without understanding this, you may over-process sound data.
- Per base sequence content: uneven first 10 to 13 bp: RNA-seq libraries begin with random hexamers, producing biased base composition at the start. This is a known normal effect, so there is no need to trim it.
- High Sequence duplication / Overrepresented sequences: highly expressed genes produce many identical reads. This is a real biological signal, not an error. It would be problematic in DNA-seq but is expected in RNA-seq.
Do not look only at the traffic-light colour. Distinguish signals that arise because the data is RNA-seq.
QC results to next action
Section titled “QC results to next action”High adapter content → remove adapters during trimmingLow quality at read end → quality-trim the endGood overall → light trimming or align unchangedSharp N/anomaly at a position → suspect instrument/lane problem and investigateReading an actual report: interpreting each graph
Section titled “Reading an actual report: interpreting each graph”The graphs below come from FastQC on a sample of the public human RNA-seq run DRR024878, with 2.24 million read pairs, 100 bp, before trimming. Each figure shows how to read one module.
Per base sequence quality 🟢
Section titled “Per base sequence quality 🟢”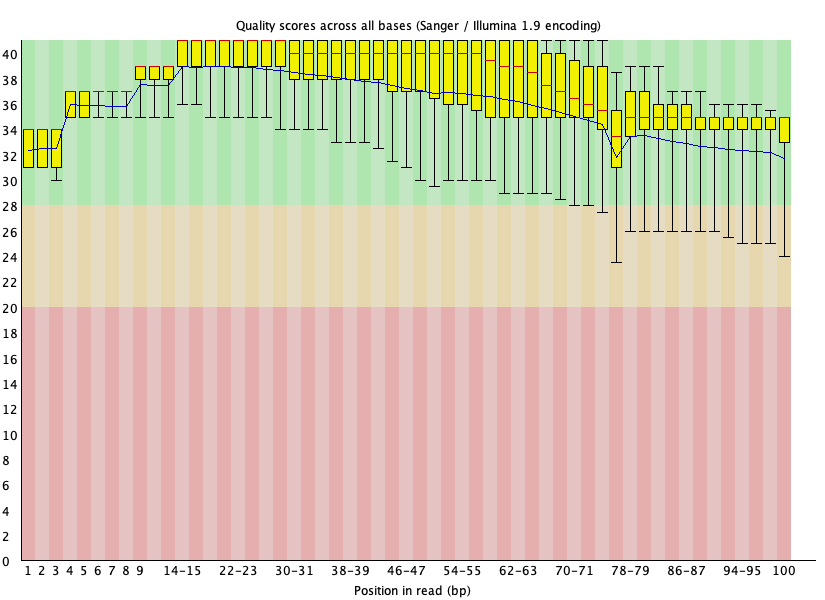
- How to read: x is position and y is quality. The box, showing quartiles, and blue median line at each position are good when they stay in green, Q28 or higher. Trim positions where the box falls into yellow or red.
- This data: quality declines slightly toward the end, but the median stays around Q32 through position 100 and remains green. Quality trimming is barely needed.
Per sequence quality scores 🟢
Section titled “Per sequence quality scores 🟢”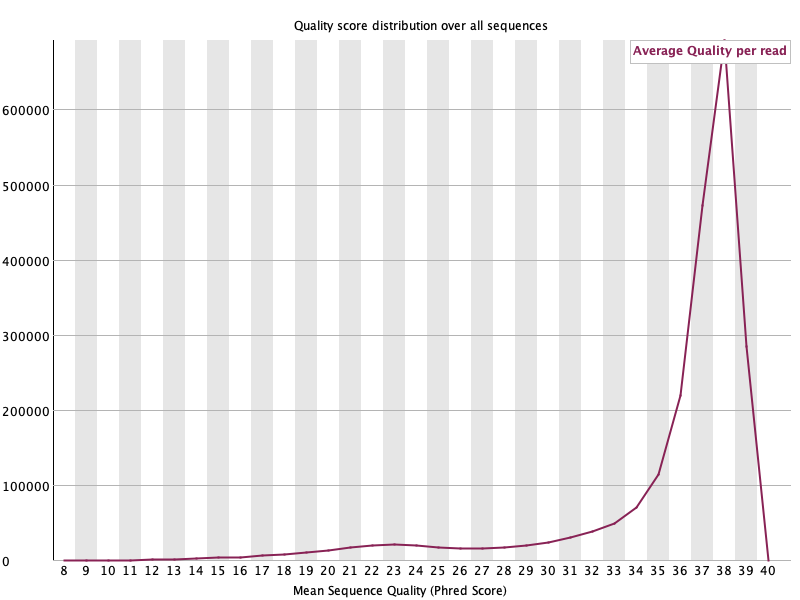
- How to read: distribution of mean quality for each read. A peak concentrated at high Q is better. A separate low-Q peak indicates a poor-read population.
- This data: a sharp single peak at Q38 means most reads are high quality, with a negligible low-quality tail. 🟢
Per tile sequence quality 🟢
Section titled “Per tile sequence quality 🟢”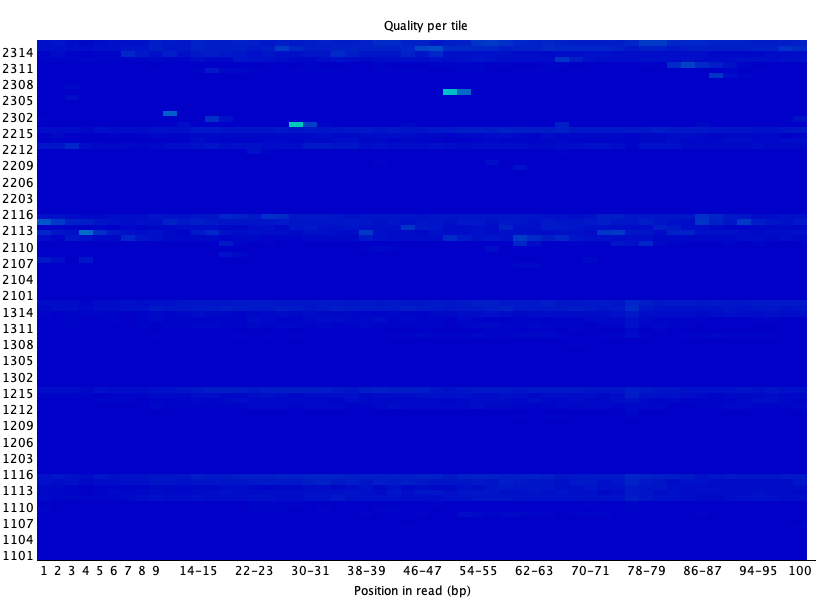
- How to read: a flow-cell tile by row and position by column heat map. Blue means at or above the mean for that location; warm colours mean below the mean. A red line across a tile indicates a physical problem such as a bubble or dust in that section. See From Library to FASTQ for the tile concept.
- This data: nearly all uniform blue, with only a few faint spots, so there is no physical anomaly. 🟢
Per base sequence content 🔴, normal
Section titled “Per base sequence content 🔴, normal”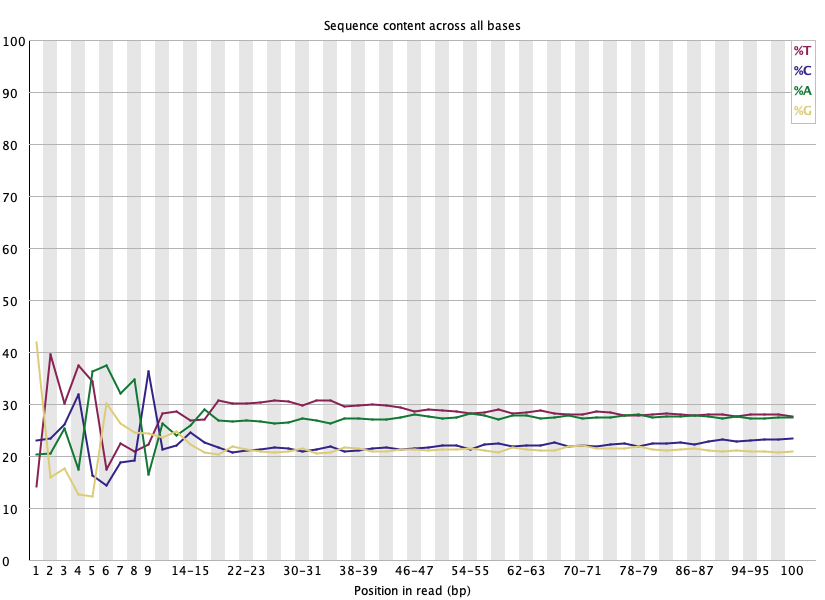
- How to read: proportions of the four bases by position. In theory they should be flat; large positional differences produce FAIL.
- This data: the first approximately 12 bp fluctuate, followed by flat lines. FastQC marks this as FAIL, but it is normal random-hexamer priming bias in RNA-seq. No action is needed.
Per sequence GC content 🟢
Section titled “Per sequence GC content 🟢”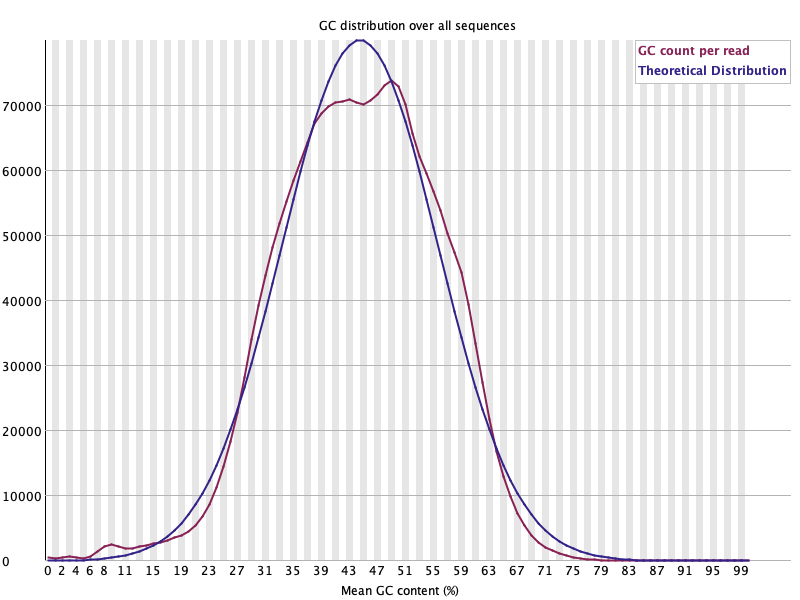
- How to read: whether the observed GC% distribution by read, red, follows the theoretical normal distribution, blue. An unexpected peak can signal contamination from another organism, rRNA, or adapters.
- This data: the observation follows the theoretical curve well and peaks at approximately 45%. There is a slight shoulder but no large second peak, so there is no sign of contamination. 🟢
Per base N content 🟢
Section titled “Per base N content 🟢”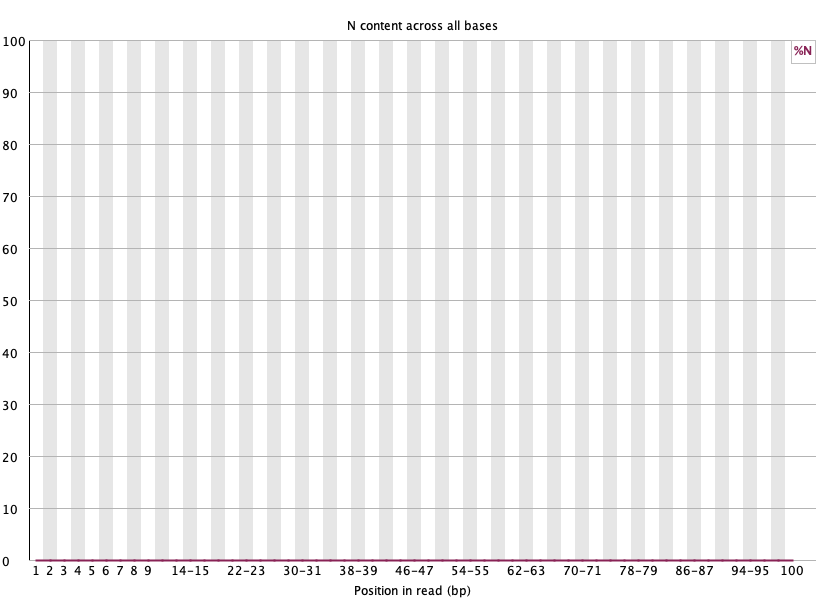
- How to read: the proportion of N, or failed calls, at each position. It should stay at 0. A sharp rise at a position suggests an equipment or chemistry problem.
- This data: 0 throughout, so there is no problem. 🟢
Sequence Length Distribution 🟢
Section titled “Sequence Length Distribution 🟢”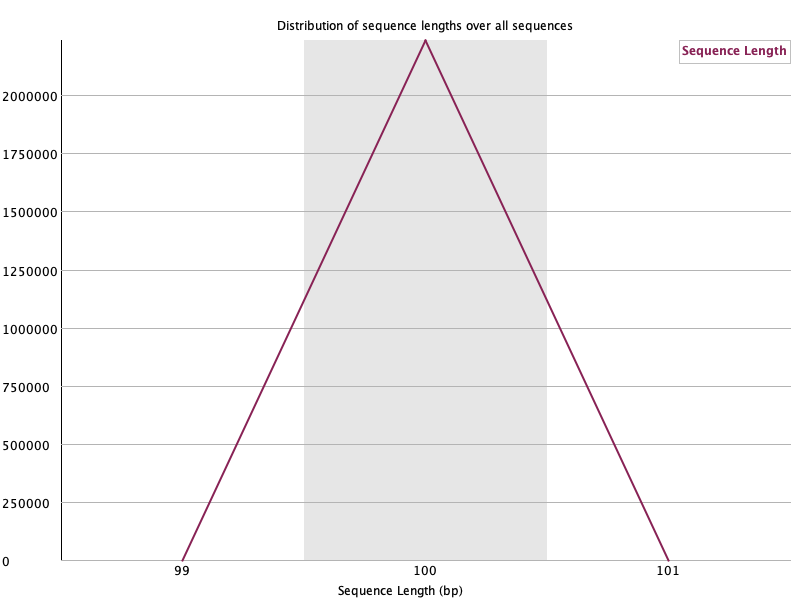
- How to read: read-length distribution. Before trimming, it usually concentrates at one value.
- This data: a single spike at 100 bp, meaning every read is 100 bp. 🟢 After trimming, lengths spread out and produce WARN; that is normal.
Sequence Duplication Levels 🟢
Section titled “Sequence Duplication Levels 🟢”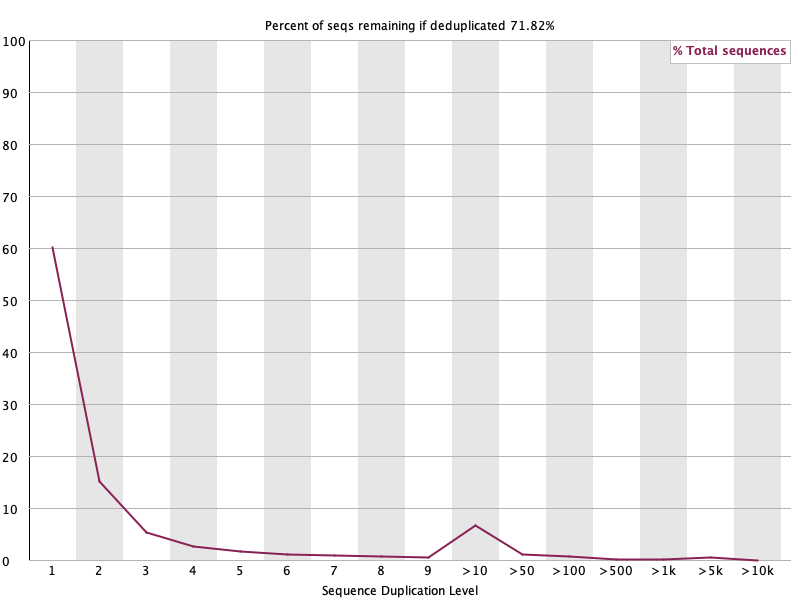
- How to read: how many times identical sequences are duplicated. A higher ”% remaining if deduplicated” in the title means less duplication.
- This data: 71.82% remain after removal, approximately 28% duplication, and most are unique at level 1. The small
>10peak comes from highly expressed genes and polyA tails, which is normal in RNA-seq. 🟢
Adapter Content 🟡
Section titled “Adapter Content 🟡”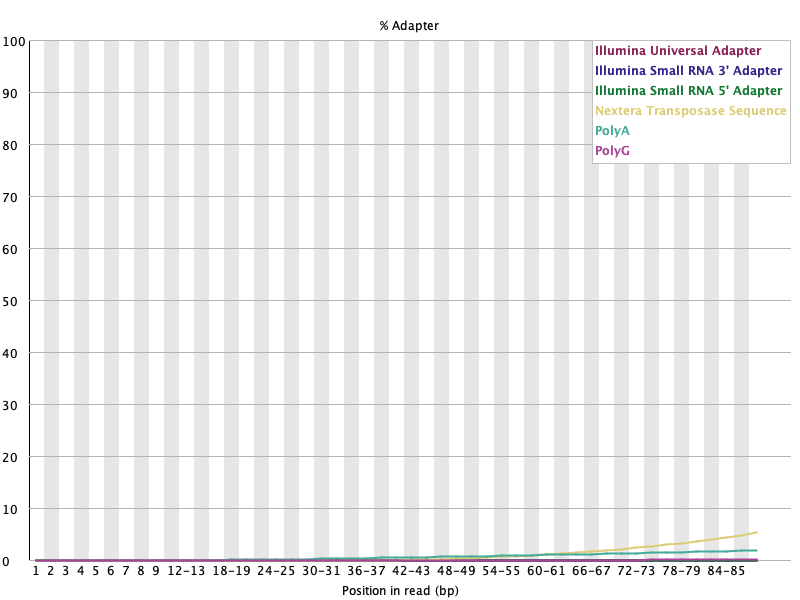
- How to read: cumulative adapter-sequence content by position. A rise toward the end means the adapter was read through.
- This data: most values are near 0, but Nextera, the yellow line, rises to approximately 5% near the read end at about 88 bp, producing WARN. This is direct evidence for adapter trimming. 🟡
Overall judgement
Section titled “Overall judgement”- Quality is excellent, with both per-base and per-sequence quality 🟢, so quality trimming should be minimal.
- The only FAIL and WARN items are Per base content, normal in RNA-seq, and Adapter content, a small amount of adapter at the end.
- The conclusion is that light trimming focused on adapters and polyA is sufficient.
Run it again after trimming: before/after validation
Section titled “Run it again after trimming: before/after validation”FastQC is not run only once. The standard flow is QC → trimming → QC again.
FASTQ ──FastQC (before)──▶ diagnose problems ──trimming (fastp)──▶ cleaned FASTQ ──FastQC (after)───▶ verify improvement ──▶ alignmentReasons to run FastQC again after trimming:
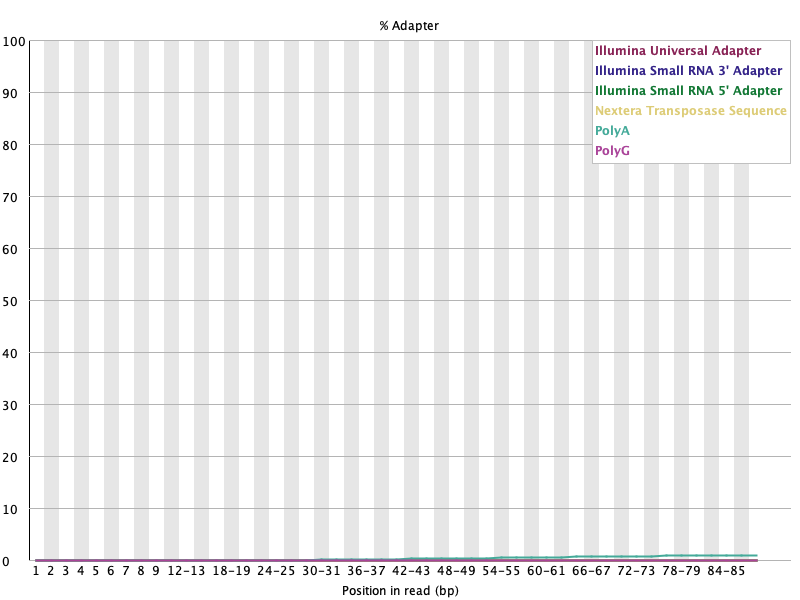
- Confirm that adapters were actually removed, so WARN should disappear.
- Confirm that quality was maintained or improved and did not worsen.
- Confirm that trimming was not excessive, producing overly short reads or unusual signals.
Actual before/after traffic-light changes
Section titled “Actual before/after traffic-light changes”FastQC comparison of the same sample before and after trimming:
| Item | before | after | Interpretation |
|---|---|---|---|
| Adapter Content | 🟡 WARN | 🟢 PASS | Adapter removed: the purpose of trimming was achieved ✅ |
| Sequence Length Distribution | 🟢 PASS | 🟡 WARN | Lengths became varied: expected after trimming, normal |
| Per base sequence content | 🔴 FAIL | 🔴 FAIL | Random hexamer, biological, so trimming does not change it |
| Per base/sequence quality | 🟢 | 🟢 | Quality maintained |
The point is: what should improve, adapters, improved; what must not worsen, quality, stayed the same. The new Length WARN is only evidence that trimming occurred.
Adapter: WARN disappeared
Section titled “Adapter: WARN disappeared”Before, Nextera rises to approximately 5% at the end:
After, nearly flat at 0:
Length distribution: a new WARN, but normal
Section titled “Length distribution: a new WARN, but normal”Before, all reads are 100 bp in one spike. After, some reads are shorter and the distribution spreads out:
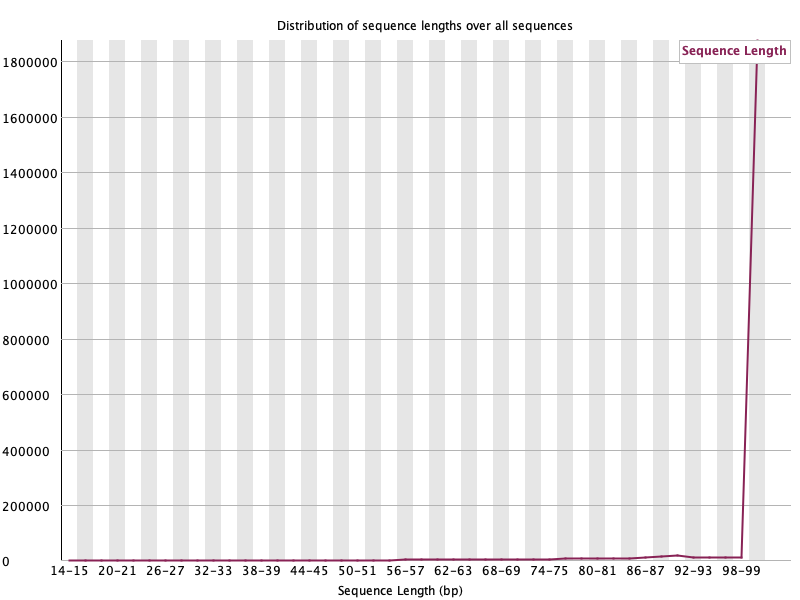
This WARN is not a problem signal but evidence that trimming worked. It is another example of why FastQC traffic lights must be read in context.
For multiple samples: MultiQC
Section titled “For multiple samples: MultiQC”With many samples, reports become scattered. MultiQC combines several FastQC results, as well as alignment and quantification logs, into one page.
Alternative and complementary tools
Section titled “Alternative and complementary tools”FastQC has been the de facto standard since 2010, but faster and more specialized tools have appeared. They can be organized by role.
Drop-in replacements: faster with almost identical results
Section titled “Drop-in replacements: faster with almost identical results”| Tool | Characteristics |
|---|---|
| Falco | A C++ reimplementation and drop-in replacement for FastQC. On average it is approximately three times faster, uses less memory, and provides nearly identical outputs and modules. It is the first alternative to consider when Java FastQC is slow or data is large. |
| Sequali | A modern C+Python tool. It is fast, checks overrepresented sequences through the end of reads, averages Phred values using expected error, supports paired-end insert size, and handles both short and long reads. |
Integrated QC and trimming: inspect while processing
Section titled “Integrated QC and trimming: inspect while processing”| Tool | Characteristics |
|---|---|
| fastp | A trimming tool that also produces an HTML QC summary. It diagnoses and cleans in one pass. Its method for estimating overrepresented sequences differs from FastQC, using periodic counts rather than a sample of the first 100,000 reads. |
| Trim Galore | A wrapper around cutadapt and FastQC. |
| HTQC / AfterQC | Earlier integrated QC and trimming tools. |
Aggregation: a higher-level tool, not a replacement
Section titled “Aggregation: a higher-level tool, not a replacement”| Tool | Characteristics |
|---|---|
| MultiQC | Combines FastQC, fastp, alignment, and quantification logs onto one page. Effectively essential when there are many samples or before/after results to compare. |
Long reads, Nanopore and PacBio: FastQC is for short reads
Section titled “Long reads, Nanopore and PacBio: FastQC is for short reads”| Tool | Characteristics |
|---|---|
| NanoPlot | Plots length and quality distributions from FASTQ or summary files. |
| pycoQC | Interactive QC based on Nanopore sequencing_summary.txt. |
| ToulligQC · LongReadSum | Nanopore QC and summaries. |
These tools are weaker at diagnosing sequence composition, duplication, and adapter contamination, so their purpose differs from FastQC-like tools.
Contamination screening: an area where FastQC is weak
Section titled “Contamination screening: an area where FastQC is weak”| Tool | Characteristics |
|---|---|
| FastQ Screen | Compares reads against multiple genomes to determine which organism they came from, detecting contamination and mixing. |
| Kraken2 | Checks sample purity through k-mer-based classification. |
How to choose
Section titled “How to choose”- For a faster FastQC, use Falco, a drop-in replacement.
- To process trimming and QC together, use fastp.
- To collect multiple samples and reports, use MultiQC.
- For Nanopore long reads, use NanoPlot or pycoQC.
- If you suspect contamination, use FastQ Screen or Kraken2.
- FastQC remains so widely used that it is still valuable as a reference point.
References: Falco (Bioinformatics, 2021) · Sequali (Bioinformatics Advances, 2025)
In one line: FastQC is the first tool for diagnosing read quality. It does not change data, only produces a report, and its results determine how to trim. The key in RNA-seq is distinguishing normal FAIL modules, including random-hexamer bias and highly expressed duplicates.