LOCRC Exercise 2: Finding Functions and Pathways with GO and GSEA
1. What you will practice
Section titled “1. What you will practice”This exercise asks one question.
How can we find biological functions and pathways that recur across thousands of differential-expression results?
LOCRC Exercise 1 compared Tumor with adjacent Normal tissue in GSE251845. A paired DESeq2 analysis of the two tissues from 22 patients retained 24,116 genes after low-expression filtering. Of these, 8,256 passed both padj < 0.05 and |log2FoldChange| >= 1.
Reading 8,256 gene names in sequence does not reveal the shared structure of the result. This page compares the genes with gene sets organized from existing biological knowledge. It first runs over-representation analysis (ORA) on selected DEG lists, then gene set enrichment analysis (GSEA) on the complete gene ranking.
Inputs carried over from the first exercise
Section titled “Inputs carried over from the first exercise”Continue in the same colorectal-deg project. The following files must be present.
| Input | Contents | Use on this page |
|---|---|---|
outputs/GSE251845_tumor_vs_normal_PyDESeq2.csv | log2FoldChange, padj, and other fields for 24,116 genes | DEG selection, ORA background, and GSEA ranking |
outputs/ensembl-to-symbol.csv | Mapping between Ensembl gene IDs and human gene symbols | Consistent identifiers in tools and figures |
analysis.py | Code from data validation through DEG-candidate inspection | Location where GO and GSEA code is added |
If these files are absent, complete the prompts in LOCRC Exercise 1 first. This page does not repeat DESeq2 from the original counts. It focuses on converting a gene-level results table into a function-level results table.
Build two inputs from the same results table
Section titled “Build two inputs from the same results table”ORA and GSEA start from the same DESeq2 result but accept differently shaped inputs.
| Method | Input constructed from the result | Question in one line |
|---|---|---|
| ORA | A selected gene list and a background | Does the Tumor-up list passing the DEG criteria contain more cell-cycle-related genes than expected? |
| GSEA | Every gene and a ranking score | For example, do cell-cycle-related genes cluster near the top or bottom of the ranking? |
The ORA inputs in this exercise are 3,631 Tumor-up genes and 4,625 Tumor-down genes. The GSEA input includes every gene for which a ranking can be constructed, whether or not it crossed the DEG boundary. Understanding this difference is necessary to explain why the two methods can produce different results.
One cutoff separates the ORA and GSEA inputs
Section titled “One cutoff separates the ORA and GSEA inputs”The following hypothetical result illustrates the difference between the methods.
| gene | log2FoldChange | padj | Tumor-up ORA list | Position in GSEA |
|---|---|---|---|---|
GENE_A | 2.4 | 0.001 | Included | Near the top |
GENE_B | 1.1 | 0.020 | Included | Near the top |
GENE_C | 0.9 | 0.030 | Excluded | Close to the top |
GENE_D | 0.4 | 0.300 | Excluded | Near the middle |
GENE_E | -1.3 | 0.010 | Included in Tumor-down | Near the bottom |
GENE_B and GENE_C have similar changes, but the |log2FoldChange| >= 1 boundary places them on opposite sides of the ORA selection. GSEA keeps both near the top of the ranking. ORA makes the DEG list that passed the cutoff easy to explain, while GSEA can retain same-direction evidence from genes just outside the cutoff.
Unpacking the ORA question
Section titled “Unpacking the ORA question”ORA asks:
Does the Tumor-up gene list passing my DEG criteria contain more cell-cycle-related genes than expected if genes were selected at random?
The reason for asking is to determine whether a shared function repeats across several genes instead of relying on one gene-level result.
Imagine a box containing 100 balls. Each ball is one gene, and 10 balls carry a cell cycle tag. You select 20 Tumor-up candidates.
- A random selection of 20 would contain about 2 cell-cycle balls on average.
- If the actual 20 candidates contain 8 cell-cycle balls, that tag is unusually concentrated in the candidate list.
- If the list contains only 1 or 2, there is little reason to call the tag over-represented.
ORA calculates whether an overlap this large could plausibly arise by chance. The first conclusion depends on the answer.
| ORA result | What you can say first | What you still cannot say |
|---|---|---|
| A cell-cycle term is significant in Tumor-up | Genes related to the cell cycle occur more often than expected among candidates strongly increased in Tumor | The cell cycle became a measured number of times faster |
| An immune term is significant in Tumor-down | Immune-related genes occur more often than expected among candidates decreased in Tumor | Immune function was directly suppressed inside cancer cells |
| The term is not significant | The current candidate list does not provide evidence that this function is over-represented | The function has no biological relevance at all |
The last row matters. ORA can be nonsignificant because there is no shared signal, but it can also happen because relevant genes fell just outside the candidate cutoff. GSEA can give a different answer by inspecting the complete ranking.
Unpacking the GSEA question
Section titled “Unpacking the GSEA question”GSEA asks:
Instead of selecting only genes that pass a DEG cutoff, if every gene is ordered from the largest increase in Tumor to the largest decrease, do cell-cycle-related genes, for example, cluster near the beginning or end of the ranking?
The reason for asking is that many genes may move in the same direction even when none of their individual changes is very large.
Now imagine arranging 100 genes from the strongest increase in Tumor to the strongest decrease. Mark the positions of 10 cell-cycle genes.
- If 7 of the 10 occur within the first 20 positions, cell-cycle genes show a collective Tumor-up signal.
- If 7 occur within the last 20 positions, they show a collective signal toward higher expression in Normal.
- If all 10 are spread evenly across the ranking, there is little evidence that they move together in one direction.
GSEA summarizes this concentration with the NES(Normalized Enrichment Score). NES is not a single value for the whole analysis; it is calculated separately for every tested gene set. For example, E2F targets, G2M checkpoint, and Inflammatory response each receive their own NES. Gene sets contain different numbers of genes, so their original enrichment scores, or ES values, are difficult to compare directly. NES adjusts an ES against the score magnitude expected for that set under random permutations. Because this page places Tumor-up genes at the beginning of the ranking, a positive NES means concentration toward Tumor-up and a negative NES means concentration toward Tumor-down. A larger absolute value indicates a stronger tendency to cluster toward one end, but statistical significance must be checked with the FDR q-value, not with the NES alone.
The curve peak is therefore not the NES itself. The highest or lowest point at which the running enrichment score is farthest from zero is the ES; normalizing that ES against random results produces the NES.
This exercise sorts from large positive log2FoldChange to large negative values. Read the GSEA answers as follows.
| GSEA result | What you can say first | What you still cannot say |
|---|---|---|
| Significant positive NES | Gene-set members collectively cluster toward Tumor-up | The pathway was directly activated |
| Significant negative NES | Gene-set members collectively cluster toward Normal-up, or Tumor-down | The pathway was directly suppressed inside cancer cells |
| NES near zero or not significant | The current ranking does not show evidence that members cluster toward one side | No individual member gene is important |
Positive and negative GSEA signs do not have a fixed biological meaning. The ranking score and sort direction determine them. Positive NES means Tumor-up here because this page places Tumor-up genes first.
Reading the two answers together
Section titled “Reading the two answers together”ORA and GSEA do not repeat the same test. One examines the proportion inside a selected candidate list, while the other examines positions across the complete ranking.
| ORA | GSEA | Interpretation to check first |
|---|---|---|
| Significant | Significant in the same direction | Both large candidate changes and the complete ranking support the same functional signal |
| Not significant | Significant | Few genes may cross the large-change cutoff, while many smaller changes cluster broadly in one direction |
| Significant | Not significant | A selected subset overlaps strongly, but the complete gene set may not move together in one direction |
| Not significant | Not significant | The current candidate rule and ranking provide little evidence for a coordinated change in that gene set |
If cell cycle appears in Tumor-up ORA and positive-NES GSEA, for example, you can summarize that cell-cycle genes are common among strongly increased candidates and also cluster toward Tumor-up when genes outside the cutoff are retained. That is what it means for the analyses to point in the same direction. RNA expression alone still does not establish protein activity or the actual rate of cell division.
2. Turn genes into functional sets
Section titled “2. Turn genes into functional sets”One row in a DESeq2 results table describes one gene. As an illustration, suppose three rows show that CDK1, CDC20, and MCM2 all increased in Tumor. This result does not by itself explain what the genes do together. We therefore compare each gene ID with prepared functional lists.
| Illustrative gene-level result | Example lists found in functional resources |
|---|---|
Increased CDK1 | GO cell cycle, Reactome Cell Cycle, and Hallmark E2F_TARGETS |
Increased CDC20 | GO cell cycle, Reactome Cell Cycle, and Hallmark E2F_TARGETS |
Increased MCM2 | DNA-replication GO terms and Reactome pathways, and Hallmark E2F_TARGETS |
This step does not turn a gene into a different object. It matches the gene-level result against resource membership tables, then regroups genes linked to the same entry. One gene can participate in several functions, so it can appear in several lists at once.
Gene Ontology: collect functional tags attached to genes
Section titled “Gene Ontology: collect functional tags attached to genes”The GO:BP branch of Gene Ontology records which biological processes a gene product participates in using standard terms. For example, GO:0007049 cell cycle names the overall process in which a cell replicates and partitions its genetic material.
Suppose genes such as CDK1, CCNB1, and CDC20 are linked to this term. If many of them occur in the Tumor-up list, ORA tests, “Does the cell cycle tag occur more often than expected among Tumor-up genes?”
GO is strong at classifying participation in the same process. It is not a map saying that CDK1 acts and then CDC20 acts. More specific terms such as mitotic cell cycle and chromosome segregation are also connected below cell cycle, so several similar-looking results can appear together.
Reactome: group connected reactions into a pathway
Section titled “Reactome: group connected reactions into a pathway”Reactome’s R-HSA-1640170 Cell Cycle is a pathway connecting molecules and reactions involved in the cell cycle. Its map contains concrete scenes such as complexes formed by CCNB1 and CDK1 and the degradation of mitotic proteins involving CDC20.
When Reactome is supplied to ORA, this complex map is flattened into a simple gene list like this.
R-HSA-1640170 Cell Cycle→ CDK1, CCNB1, CDC20, ...The Cell Cycle pathway can be significant when this list overlaps strongly with Tumor-up. The information used by ORA is which genes belong to the pathway. It does not mean that the RNA-seq result verified reaction order, protein modification states, or intracellular locations.
MSigDB Hallmark: collect a representative coordinated-expression signal
Section titled “MSigDB Hallmark: collect a representative coordinated-expression signal”MSigDB Hallmark condenses recurring expression signals from many source gene sets into representative lists. Unlike Reactome, it is not a map of reactions in order. It is closer to a gene list that characterizes a biological state.
For example, HALLMARK_E2F_TARGETS contains cell-cycle-related genes known as targets of E2F transcription factors.
HALLMARK_E2F_TARGETS→ CDK1, CDC20, MCM2, PCNA, ...GSEA takes one such list at a time and compares it with the complete gene ranking. If members such as CDK1, CDC20, MCM2, and PCNA cluster toward Tumor-up, HALLMARK_E2F_TARGETS can receive a positive NES. GSEA then takes HALLMARK_G2M_CHECKPOINT and repeats the calculation separately from the beginning.
Put the three resources side by side
Section titled “Put the three resources side by side”Even when all three resources describe a cell-cycle signal, they name and delimit it differently.
| Resource | Original viewpoint | Form mainly used in the calculation | Reading in this example |
|---|---|---|---|
| GO:BP | Which process does this gene participate in? | Genes linked to each term | cell cycle genes are common in Tumor-up |
| Reactome | Which molecular reactions form a connected flow? | Genes included in each pathway | Cell Cycle pathway genes are common in Tumor-up |
| Hallmark | Which genes from a representative expression signal move together? | A gene set curated to reduce redundancy | E2F_TARGETS members cluster toward Tumor-up |
If cell-cycle-related results appear in all three resources, do not immediately count them as three independent discoveries. Inspect the member lists to determine whether overlapping genes are expressing the same change through three different knowledge systems.
3. Run ORA on selected DEG lists
Section titled “3. Run ORA on selected DEG lists”ORA tests how strongly a selected list overlaps one functional set. Four counts are needed for each term.
| Count | Meaning in this exercise |
|---|---|
| Background size | The 24,116 genes actually tested by DESeq2 |
| Candidate-list size | 3,631 Tumor-up or 4,625 Tumor-down genes |
| Term size | Genes in the background associated with one GO term or Reactome pathway |
| Intersection size | Genes actually shared by the candidate list and the term |
Suppose an illustrative term is linked to 200 genes in the background. If 3,631 Tumor-up genes were selected at random, a simple proportional expectation would be 3,631 × 200 ÷ 24,116, or about 30 overlapping genes. If the observed overlap were 80, there would be reason to test whether genes from that function are unusually concentrated in the candidate list.
g:Profiler ORA calculates this overlap with a cumulative hypergeometric test and corrects the results from testing many terms. The result column is named p_value in this exercise, but it contains g:Profiler’s default g:SCS multiple-testing correction.
The background defines which genes could have become candidates
Section titled “The background defines which genes could have become candidates”The background is not simply every known human gene. It is the set of genes that had an opportunity to become a DEG in this experiment. A gene removed by the low-expression filter could never enter the candidate list. Using all human genes as the background would therefore add genes that were not eligible for selection.
This page uses the 24,116 genes actually tested by DESeq2 as a custom background. The g:Profiler call receives domain_scope="custom_annotated" together with the background IDs. This setting uses genes inside the custom background that have annotations in the relevant data source as the statistical domain.
Why split increased and decreased genes?
Section titled “Why split increased and decreased genes?”Combining Tumor-up and Tumor-down could show that immune-related functions are common among changed genes, but it would discard the direction that produced the result. This exercise analyzes the lists separately to distinguish two questions.
- Tumor-up ORA: which functions occur frequently among genes increased in Tumor?
- Tumor-down ORA: which functions occur frequently among genes decreased in Tumor?
Step 1 prompt: g:Profiler GO and Reactome ORA
Keep the analysis from LOCRC Exercise 1 and add over-representation analysis for Tumor-up and Tumor-down DEGs.

1. Confirm that the current folder is the colorectal-deg project and that outputs/GSE251845_tumor_vs_normal_PyDESeq2.csv and outputs/ensembl-to-symbol.csv exist. If either is missing, do not fabricate it. Report which output from LOCRC Exercise 1 is missing and stop.
2. Use genes with padj < 0.05 and abs(log2FoldChange) >= 1. Split positive values into Tumor-up and negative values into Tumor-down.
3. Use all 24,116 genes that passed the low-expression filter and were actually tested by DESeq2 as the ORA background. Explicitly provide domain_scope="custom_annotated" and the background list to g:Profiler, and print the background size.
4. Use GProfiler from gprofiler-official with organism="hsapiens" and sources=["GO:BP", "REAC"] to analyze each list separately.
5. State in code comments and output explanations that p_value in the result has g:Profiler multiple-testing correction applied.
6. Save source, native, name, term_size, intersection_size, p_value, and intersections to outputs/ora-up.csv and outputs/ora-down.csv. Preserve Ensembl IDs in intersections and add intersection_symbols using the mapping from the first exercise.
7. For the 15 smallest p_value terms in each direction, draw a horizontal bar chart of -log10(p_value). Distinguish GO:BP from REAC by color and save outputs/ora-up.png and outputs/ora-down.png.
8. Compare intersections to determine whether the top terms repeatedly share the same genes, and group terms with overlapping meanings in the explanation.
9. Run uv run python analysis.py and inspect both plots directly. Explain in English the prominent functions in Tumor-up and Tumor-down, then stop.

You must explain the limitation that changing the gene-list criterion also changes the ORA result.
The actual run analyzed 3,631 Tumor-up and 4,625 Tumor-down genes separately. It used the 24,116 genes tested by DESeq2 after low-expression filtering as the background. After g:SCS correction, 197 and 395 terms respectively were significant. Result tables were saved to outputs/ora-up.csv and outputs/ora-down.csv.
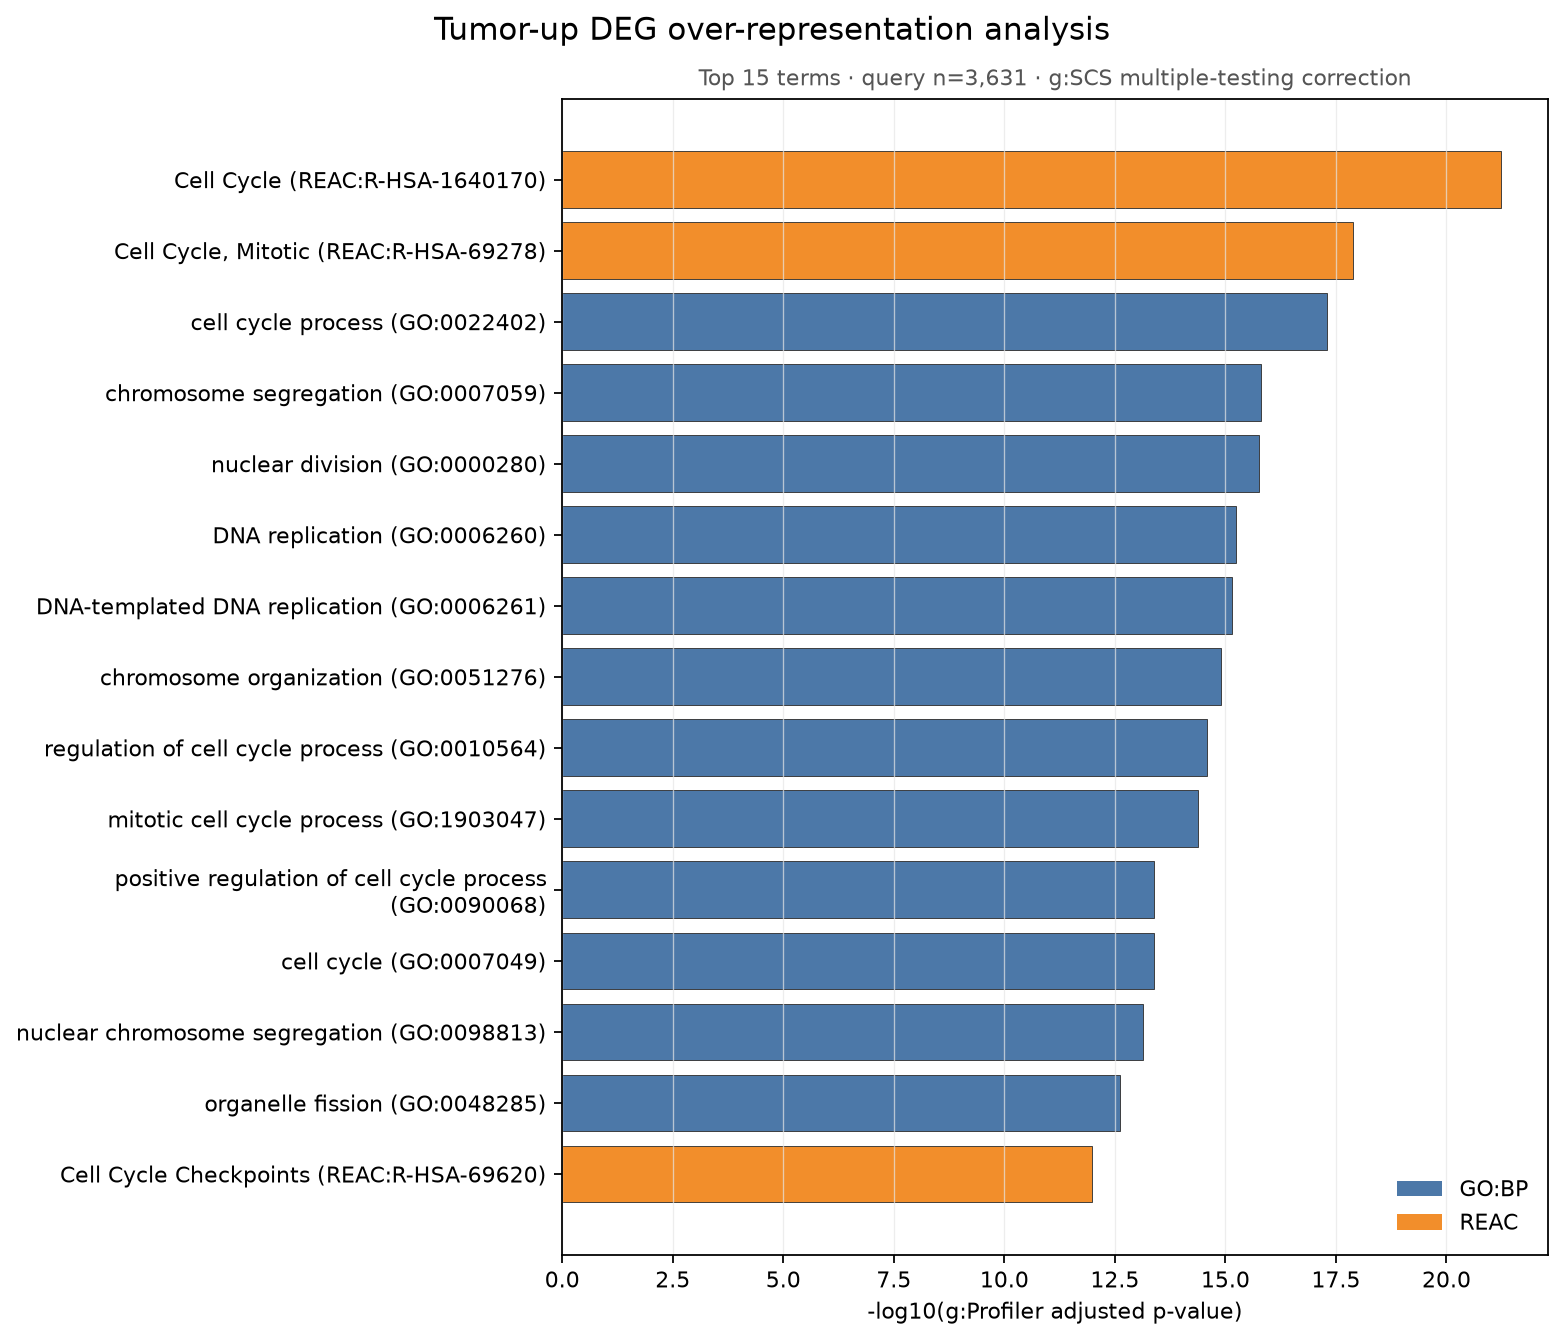
outputs/ora-up.png from the current experiment. DEGs increased in Tumor contain many genes related to the cell cycle, chromosome segregation, and DNA replication.
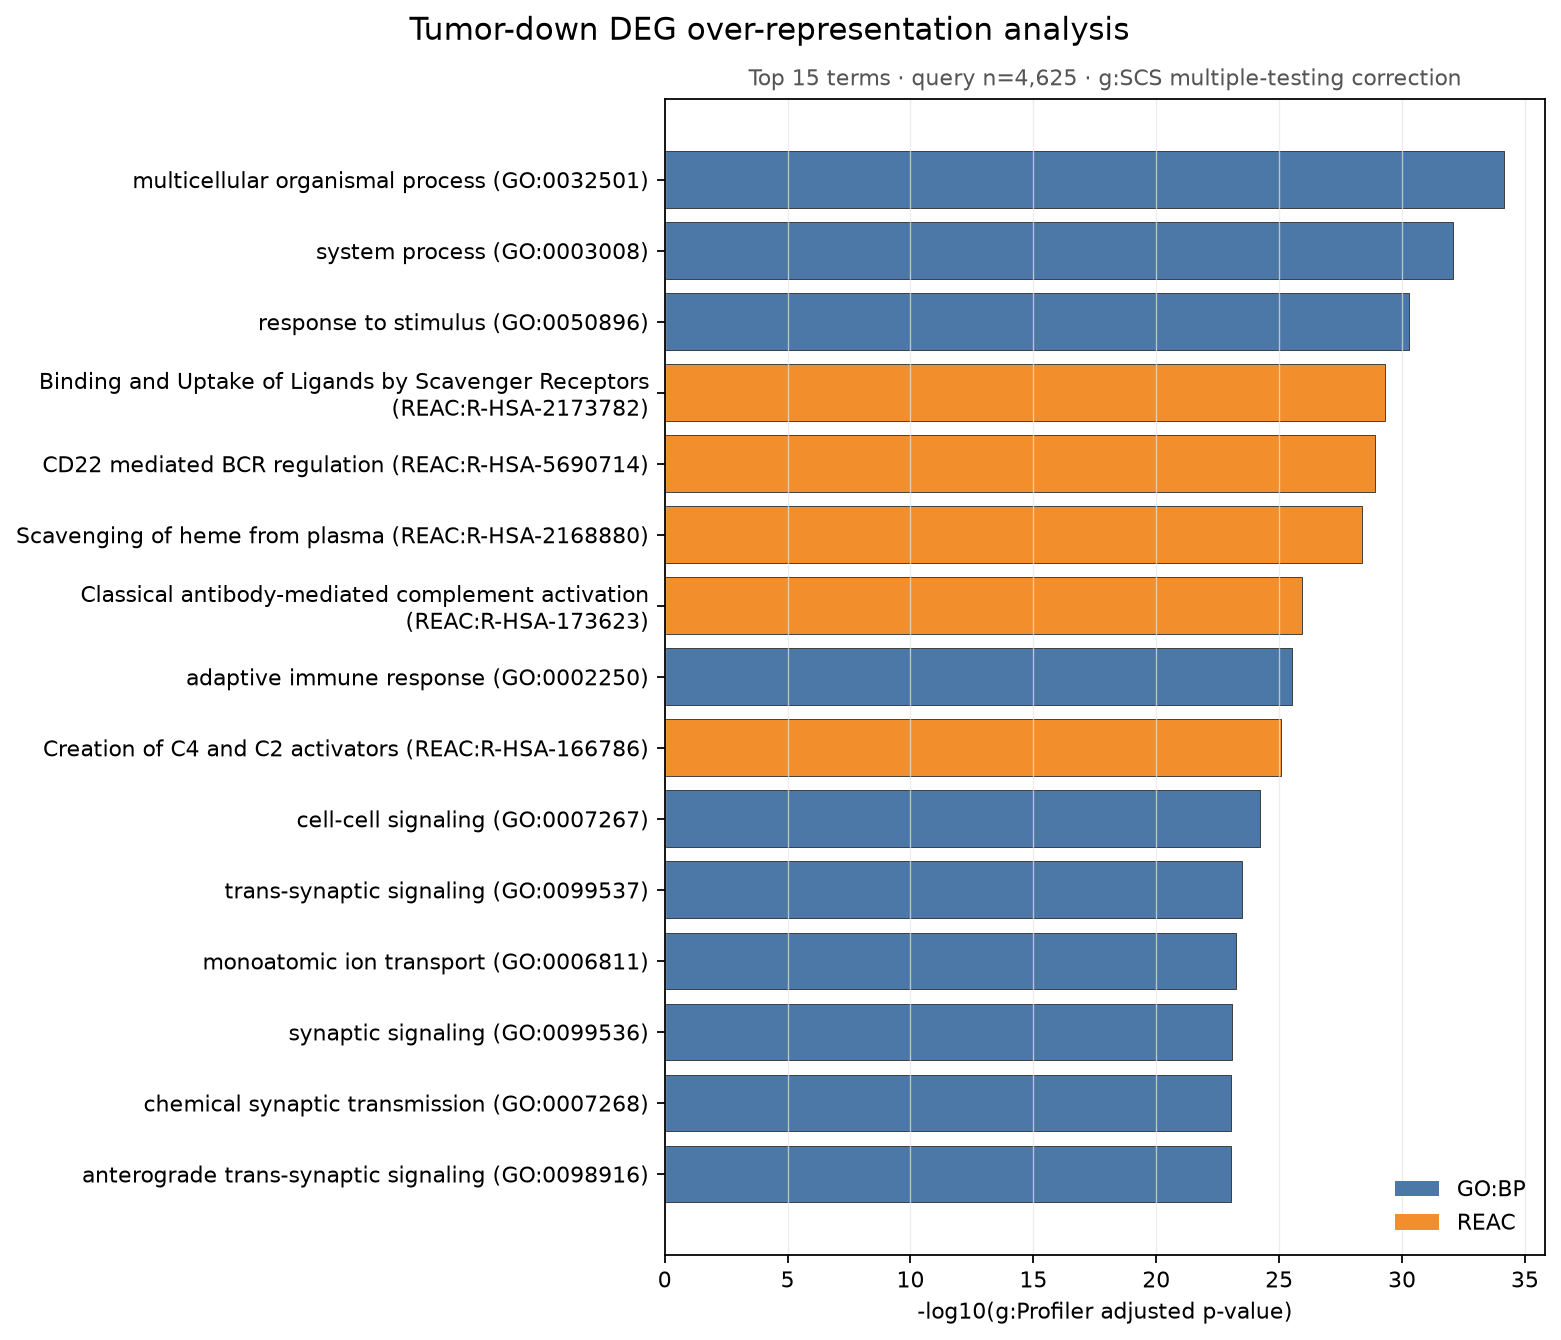
outputs/ora-down.png from the current experiment. DEGs decreased in Tumor contain many genes related to multicellular-organism processes, responses to stimuli, intercellular signaling, and immune functions.
A longer bar means a smaller corrected p-value. It does not mean that expression changed more or that the process operated more strongly. Check expression change in the original DEG table. The ORA bar shows how unexpectedly concentrated the functional annotations are within the selected list.
Group related terms into one signal
Section titled “Group related terms into one signal”Similar names such as Cell Cycle, Cell Cycle, Mitotic, and Chromosome Segregation can appear together. GO is a graph connecting broader and narrower terms, while Reactome places detailed pathways inside broader pathways. These terms consequently share some of the same genes.
Compare intersection_symbols to see whether the same genes created several bars. If the overlap is large, first group the rows as a cell-cycle signal, then inspect the most specific term supported by the current data. Do not count 15 displayed terms as 15 independent findings.
4. Run GSEA on the complete gene ranking
Section titled “4. Run GSEA on the complete gene ranking”ORA requires a candidate criterion. Changing the |log2FoldChange| boundary from 1 to 0.8, or changing the padj threshold, changes the input list and can change the result. GSEA addresses the result differently. It does not cut selected genes from the rest. Instead, it ranks every gene from higher in Tumor to higher in Normal.
This exercise uses log2FoldChange as the ranking score.
Higher in Tumor Higher in Normallarge positive LFC → small positive → 0 → small negative → large negativeIf genes from one set cluster on the left, they carry a Tumor-up signal. If they cluster on the right, they carry a Normal-up signal. Changing the score or sort direction can change the meaning of the sign, so record the score and descending sort explicitly.
The running enrichment score walks down the ranking
Section titled “The running enrichment score walks down the ranking”GSEA moves through the ranked table one row at a time.
- If the current gene belongs to the tested gene set, the running score rises.
- If it does not belong, the score falls slightly.
- The score moves farther from zero when members cluster toward one end of the ranking.
- The largest deviation from zero becomes the enrichment score (ES).
Highly ranked genes can receive greater weight. The calculation therefore considers not only how many members occur, but also where they occur and how large their ranking scores are.
ES, NES, and the leading edge
Section titled “ES, NES, and the leading edge”| Result | First meaning to read |
|---|---|
ES | How strongly the gene set clusters toward one end of the current ranking |
NES | ES normalized to make comparisons across gene sets more useful |
NOM p-val | Fraction of permutations producing a result at least as extreme as the current ES |
FDR q-val | Estimated false discovery rate after examining many gene sets |
Lead_genes | Members contributing most strongly to the ES peak |
A positive NES means members cluster toward Tumor-up in this descending ranking. A negative value means they cluster toward Normal-up. NES is not a unit measuring how far a pathway is switched on or off.
If NOM p-val is displayed as zero, the probability is not literally zero. It means no more extreme result appeared in the 1,000 permutations, so its resolution is limited by the number of permutations.
For positive ES, the leading edge contains gene-set members encountered before the positive peak. For negative ES, it contains members that create the negative peak at the opposite end. Use these genes to trace the signal instead of interpreting only the pathway name.
Step 2 prompt: Hallmark GSEA and running-enrichment plot
Keep the previous ORA analysis and add Hallmark preranked GSEA using the complete gene ranking.

1. If gseapy is not installed, run uv add gseapy and print the installed version.
2. Reuse outputs/ensembl-to-symbol.csv saved in the first exercise to map Ensembl IDs to human gene symbols. Run g:Profiler identifier conversion again only if the file is missing. Exclude unmapped IDs. If the same symbol appears more than once, keep only the row with the largest abs(log2FoldChange).
3. Save a two-column rank table of all genes sorted by log2FoldChange descending to outputs/gsea-rank.tsv. Print the first and last rows to verify the ranking direction.
4. Use GSEApy prerank and the MSigDB_Hallmark_2020 gene set. Set min_size=15, max_size=500, permutation_num=1000, threads=1, and a fixed seed for reproducibility.
5. Save Term, ES, NES, NOM p-val, FDR q-val, Tag %, Gene %, and Lead_genes to outputs/gsea-hallmark.csv.
6. Select pathways with small FDR q-val and save a dot plot with NES on the x-axis to outputs/gsea-hallmark-dotplot.png. Use red tones for positive NES and blue tones for negative NES, and let point size reflect gene-set size.
7. Show the running enrichment score, gene-hit positions, and ranked metric for E2F_TARGETS in one plot and save it to outputs/gsea-e2f-running-enrichment.png.
8. Print the top positive-NES and negative-NES pathways and their leading-edge genes.
9. Run uv run python analysis.py and inspect both plots directly. Explain in English how GSEA differs from ORA, the meaning of the NES sign, and the peak of the E2F curve, then stop.

If online gene sets or identifier conversion are unavailable, do not fabricate results. Report the exact step that is blocked.
Example GSE251845 Hallmark GSEA result table.
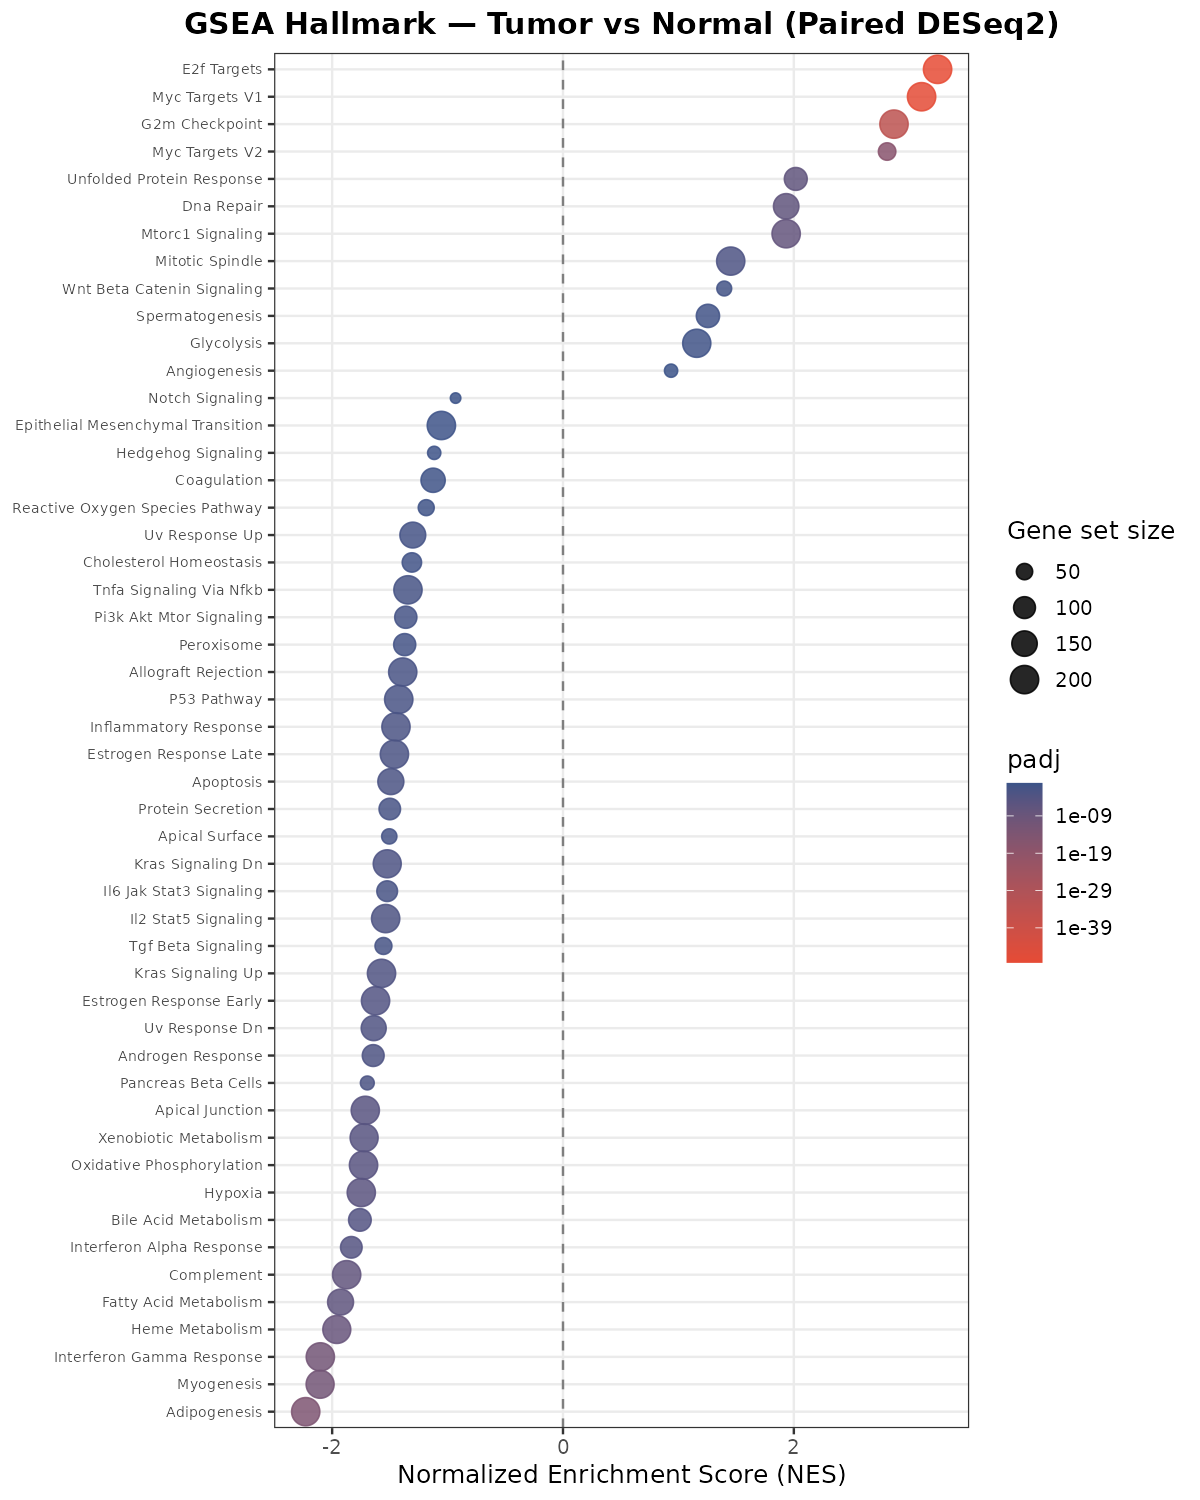
Example GSE251845 Hallmark GSEA dot plot.
Positive NES on the right includes cell-cycle and proliferation gene sets such as E2F targets, MYC targets, and G2M checkpoint. Negative NES on the left includes metabolism and immune-response gene sets such as fatty acid metabolism and interferon gamma response. Point color represents statistical evidence and point size represents gene-set size, so read them together rather than looking only at horizontal position.
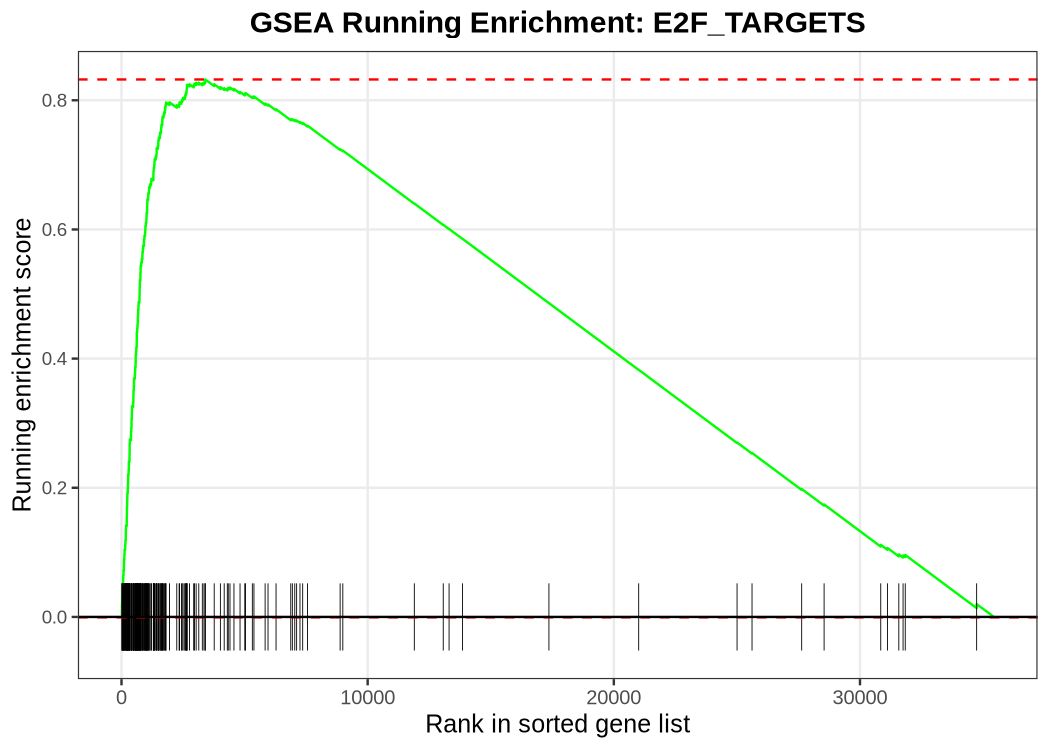
Example GSE251845 E2F_TARGETS running-enrichment plot.
The horizontal axis is the complete list ranked from genes higher in Tumor to genes higher in Normal. Black vertical marks below show where E2F_TARGETS genes occur. Their concentration near the beginning makes the green running score rise rapidly, indicating that E2F target genes cluster on the Tumor-up side.
E2F members before the peak form most of the positive leading edge. After the peak, the score falls while passing genes outside the set and returns close to zero at the end of the list.
5. Read ORA and GSEA together
Section titled “5. Read ORA and GSEA together”The methods are not competitors. They ask different questions of the same result table.
| Feature | ORA | GSEA |
|---|---|---|
| Genes used | Candidates passing a threshold | Every gene with a ranking score |
| Direction | Analyze up and down lists separately | Expressed by ranking direction and NES sign |
| Effect of a candidate cutoff | Large | No candidate cutoff used |
| Members to inspect | intersections | Lead_genes and hit positions |
| Question | Does the list passing the DEG criteria contain more cell-cycle-related genes than expected? | For example, do cell-cycle-related genes cluster toward one end of the ranking? |
In the current result, Tumor-up ORA contains cell-cycle, chromosome-segregation, and DNA-replication terms. Positive-NES GSEA likewise includes E2F targets, MYC targets, and G2M checkpoint. Proliferation-related sets therefore point in the same Tumor-up direction under two different input rules, which is an important shared pattern.
Tumor-down ORA and negative-NES GSEA include immune-response and metabolic sets. This does not by itself establish that those pathways were suppressed inside cancer cells. GSE251845 contains bulk tissues composed of several cell types, so differences in the proportions of immune and epithelial cells between Tumor and adjacent Normal can produce the same expression pattern.
Different ORA and GSEA results do not automatically indicate failure. Check the following possibilities.
- Do many genes in the same direction sit just outside the ORA cutoff?
- Do many small changes, rather than a few large changes, cluster toward one end of the ranking?
- Do GO, Reactome, and Hallmark define a related biological idea with different member genes?
- Were many genes discarded during ID conversion or collapsed into the same symbol?
- Do related terms and gene sets repeatedly share the same members?
For reproducibility, record the DEG criteria, background, ranking score and direction, ID-conversion rule, gene-set collection, analysis date, g:Profiler and GSEApy versions, permutation count, and seed.
6. Questions to answer after inspecting the results
Section titled “6. Questions to answer after inspecting the results”- Why use the 24,116 genes actually tested instead of every human gene as the ORA background?
- Why analyze Tumor-up and Tumor-down separately?
- Why should similar GO terms not be counted as independent findings?
- How can a gene excluded from ORA still contribute to a GSEA signal?
- Which conditions do positive and negative NES indicate in this ranking?
- What do the peak and leading edge in a running-enrichment plot represent?
- Why can a negative NES for an immune gene set not immediately be interpreted as immune suppression inside cancer cells?
The next early- versus later-onset colorectal cancer exercise runs the same paired analysis separately in two age groups and compares the gene-level changes directly.
Official resources
Section titled “Official resources”- Gene Ontology documentation: GO terms, three categories, and relationship structure
- g:Profiler documentation: ORA, custom backgrounds, and multiple-testing correction
- Reactome Pathway Analysis: pathway gene sets and over-representation analysis
- GSEA User Guide: ES, NES, FDR, and the leading edge
- GSEApy documentation: running
prerankin Python