08. Finding Shared Functions in a Gene List
Even with a list of 100 outlier genes, searching each name individually makes it hard to see the overall pattern. Grouping genes by known function and finding functions that appear unusually often in the candidate list can narrow the search space.
Question for this lesson: which biological functions are statistically concentrated in the candidate gene list?
The structure resembles grouping 100 error logs by service tag and asking whether one service appears more often than expected. Here, genes replace logs, while pathways and GO terms replace service tags.
| Input | Knowledge base to join | Processing | Output |
|---|---|---|---|
| Candidate gene list | Gene → function or pathway mapping | Count overlaps by function and estimate chance occurrence | Enriched terms, overlapping genes, and p-values |
1. Aggregate the list by function
Section titled “1. Aggregate the list by function”After obtaining an outlier gene list, for example the top 100, examine which biological functions connect them.
Functional enrichment analysis tools such as g:Profiler and NetworkAnalyst take a gene list as input and statistically report which pathways and GO terms contain many genes from the list. See Statistical Testing and Multiple Testing for how p-values, multiple testing, and the background gene set change the result.
In SQL-shaped pseudocode, the first aggregation looks like this. Real enrichment analysis also considers the size of each term and the number of background genes to calculate how likely an overlap this large is by chance.
SELECT annotation.term, COUNT(*) AS overlapFROM candidate_genesJOIN annotation USING (gene_id)GROUP BY annotation.termORDER BY overlap DESC;A term with a large overlap is not automatically important. A broad term containing 5,000 genes will overlap many candidates by chance. The analysis therefore uses all genes that could have been detected as a background set and tests whether the candidate list contains more members than expected for the term’s original size.
The GSE251845 ORA exercise splits Tumor-up and Tumor-down lists, defines the background, and inspects overlapping genes and adjusted p-values in the result table.
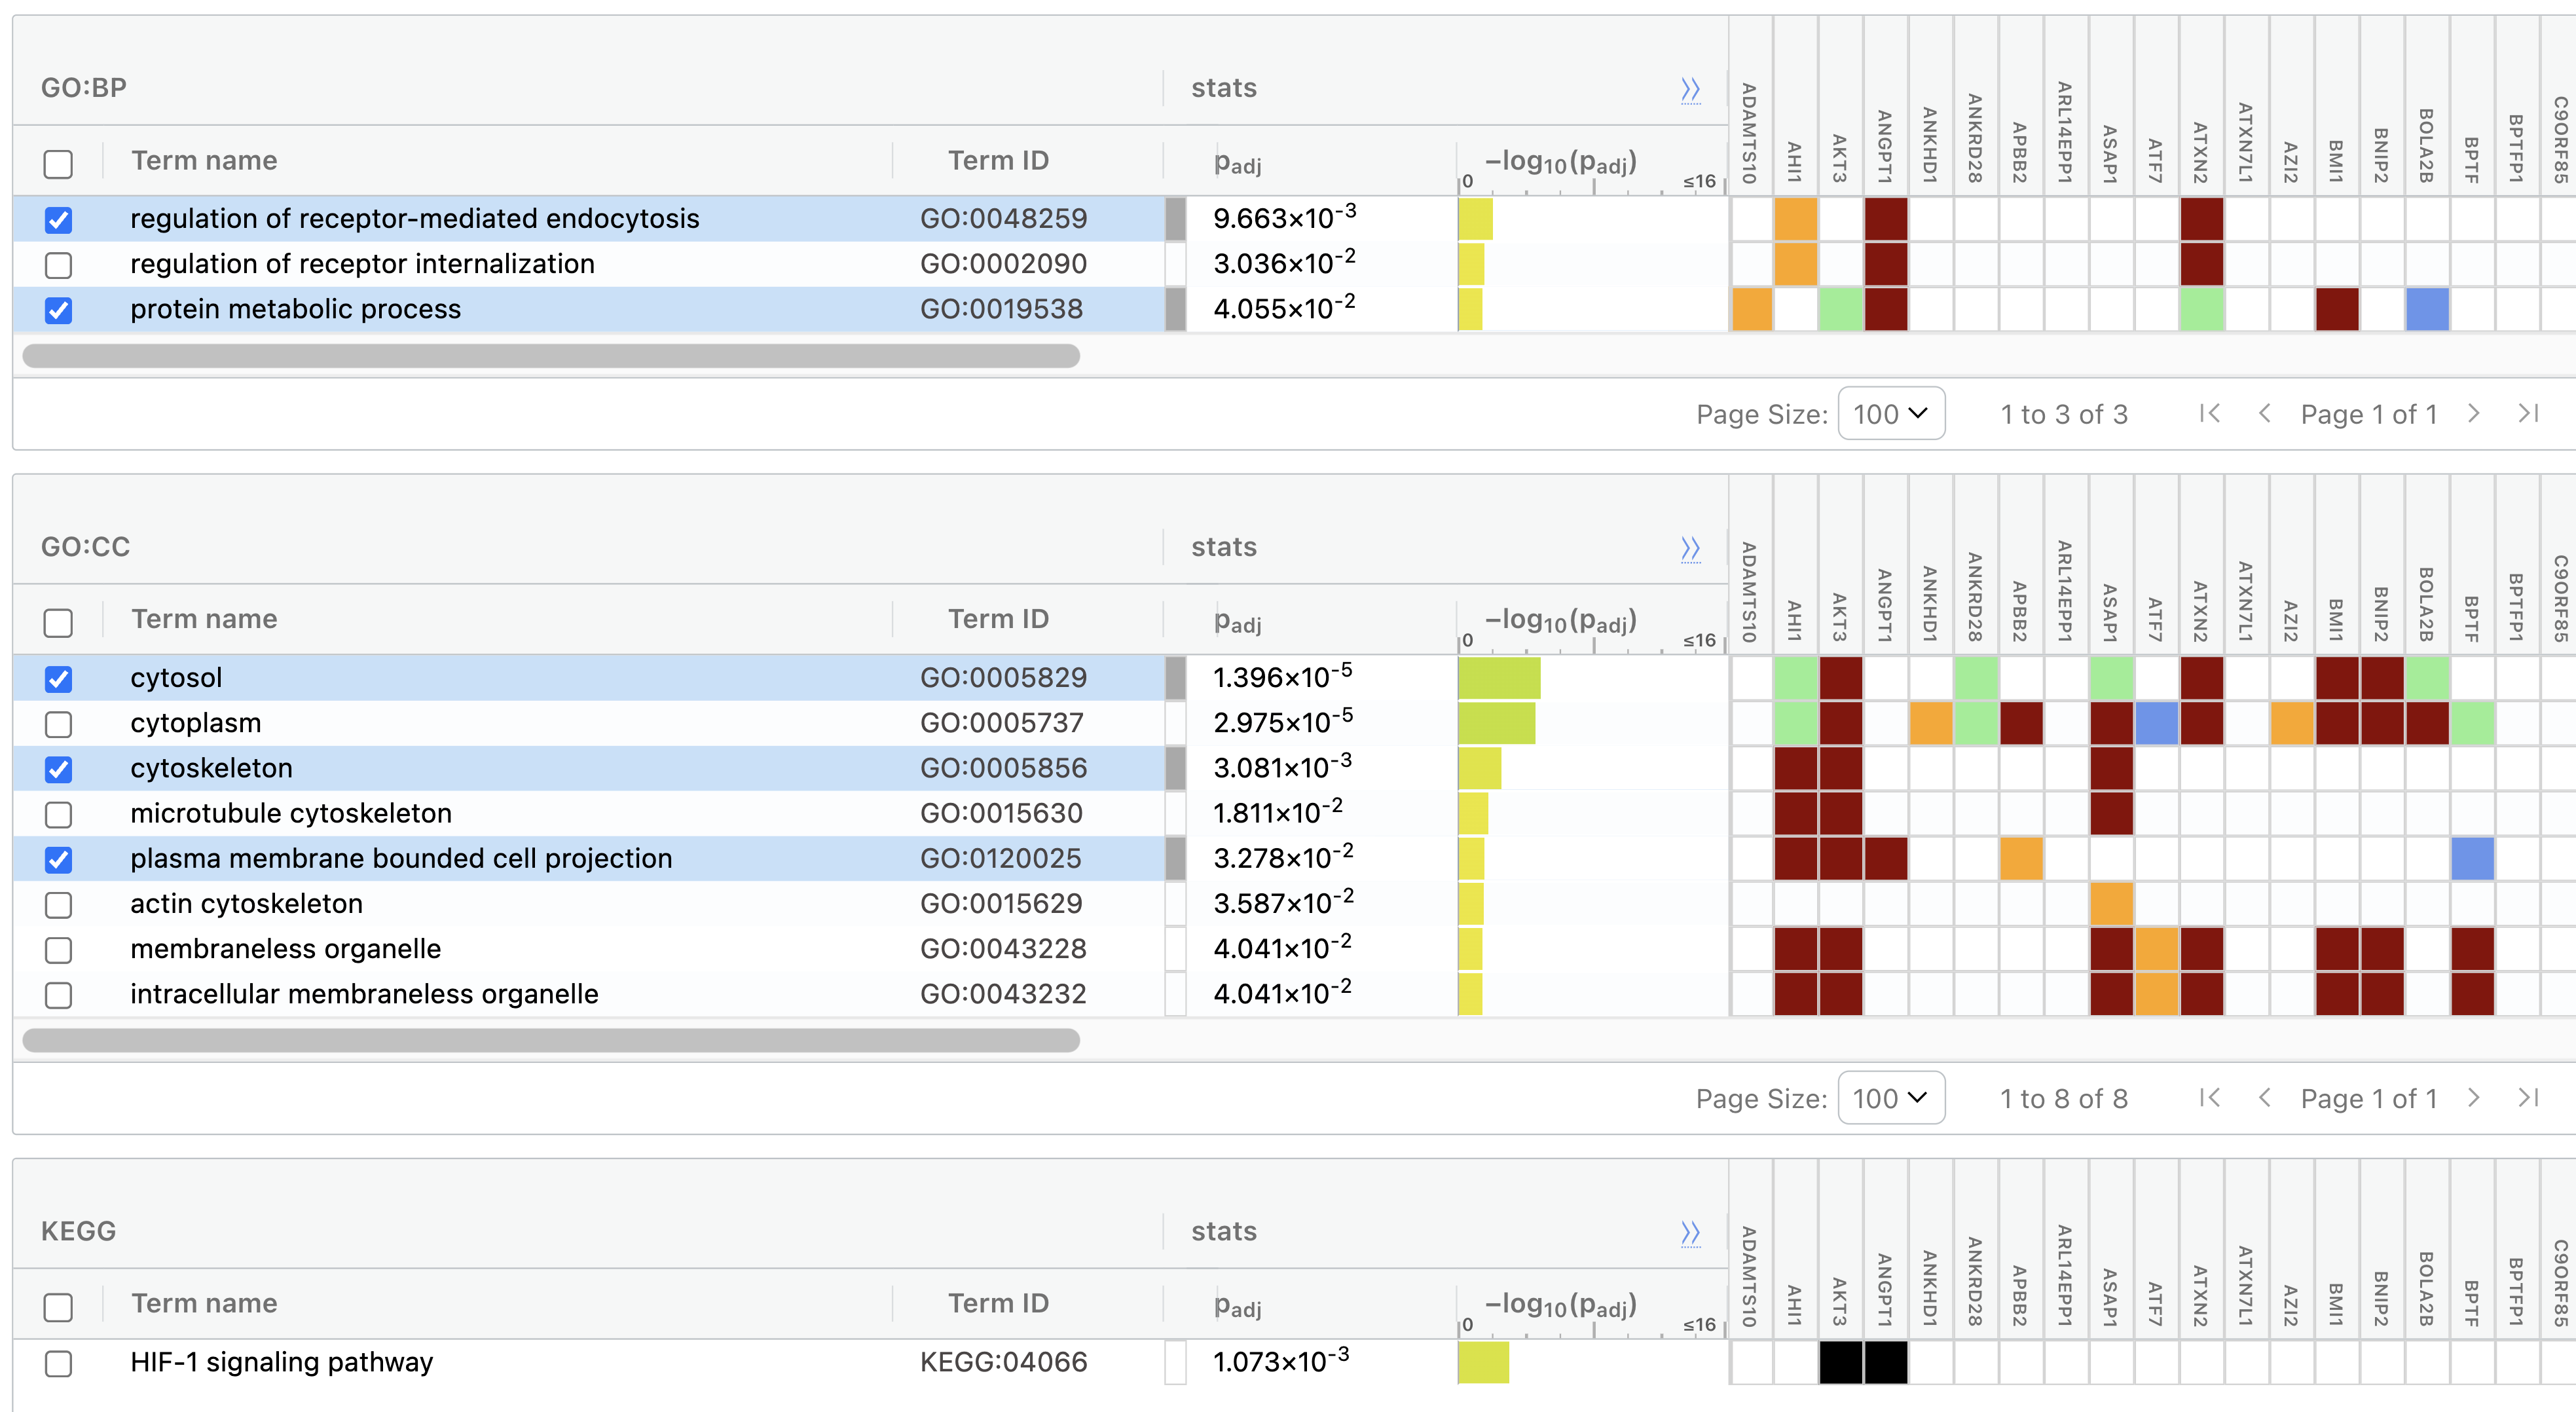
Results from entering the top 100 outliers into g:Profiler. Tumour-related terms appeared significantly, including HIF-1 signalling (hypoxia adaptation and malignancy), cytoskeleton (cell movement and metastasis), and receptor-mediated endocytosis (receptor internalization and signal amplification).
The absence of a direct osteosarcoma or cancer term does not mean the list is wrong. Broader signalling or cell-structure terms can appear first depending on annotation scope, database coverage, and the candidate-selection rule. Use the result as an index that narrows the target search, then examine literature and variant or protein data to approach causality.
Summary
Section titled “Summary”Functional enrichment analysis does not determine the role of one gene. It finds functional groups that occur more often than expected across the entire candidate list.
Candidate gene list → compare with pathway and GO databases → over-represented functions and p-values → follow-up literature review
Results depend on the criteria used to create the candidate list and on the background gene set. The absence of a cancer-related term does not mean the list is wrong, and the presence of one does not prove causality.
Next, Examining Pathway Activity in One Sample looks at the movement of related gene groups rather than one gene. When you need to inspect alignment results field by field, see Reading One SAM/BAM Record.
Sources
Section titled “Sources”- Alignment tools: STAR · Samtools
- Quantification: RSEM · featureCounts (Subread)
- Normal-tissue expression reference: GTEx Portal
- Cancer expression reference: PCAWG (Nature 2020) · EBI Expression Atlas
- Functional enrichment analysis: g:Profiler · NetworkAnalyst
- Sid’s public expression viewer: osteosarc.com/rnaseq