03. Choosing Which Biological Data to Produce
Designing biological data means choosing trade-offs among observation scope, resolution, and sample count. Instead of measuring everything at the widest and deepest setting, define the question first and produce only the data it requires.
Question for this lesson: with limited samples and cost, what scope and resolution of data should be produced?
| Design axis | Broad measurement | Deep or fine-grained measurement |
|---|---|---|
| DNA scope | Search the whole genome | Re-read selected genes deeply |
| RNA unit | Average across a tissue | Expression by cell or tissue location |
| Replication | Measure one sample deeply | Measure variation across samples or time points |
1. How broadly and deeply should DNA be read?
Section titled “1. How broadly and deeply should DNA be read?”| Method | Scope read | Why choose it |
|---|---|---|
| Gene panel | Selected genes related to a disease | Reads a narrow region very deeply and quickly |
| WES (whole-exome sequencing) | All protein-coding exons | Concentrates on approximately 1 to 2% of the genome |
| WGS (whole-genome sequencing) | All approximately 3.2 billion base pairs | Examines non-coding regions and structural changes as well |
Panels and WES use probes1 to select only the regions they need. The choice resembles deciding between scanning an entire database table and using an index to query selected rows and columns intensively.
Reading the same position several times makes it easier to distinguish accidental reading errors from real variants. If a position is read 30 times on average, it has 30x depth. For the same cost, a narrow panel can read more deeply and detect low-frequency variants present in only some tumour cells, while WGS is better suited to searching broadly across the genome.
Comparing DNA reads with a reference genome to find differences is called variant calling.2
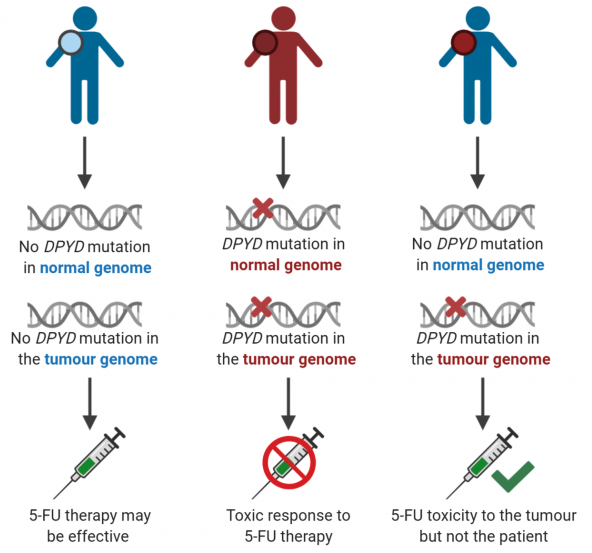
Checking DPYD variants in advance can help assess the risk of fluorouracil toxicity.
Certain variants in DPYD3 can interfere with fluorouracil breakdown. A narrow and deep test is useful when the locations to check are already known, while WES or WGS is more suitable when the cause must be searched for broadly.
The three-evidence comparison in the Rosie neoantigen PoC shows what tumour DNA, normal DNA, and RNA each contribute when they are available for candidate selection.
2. At what unit should RNA be read?
Section titled “2. At what unit should RNA be read?”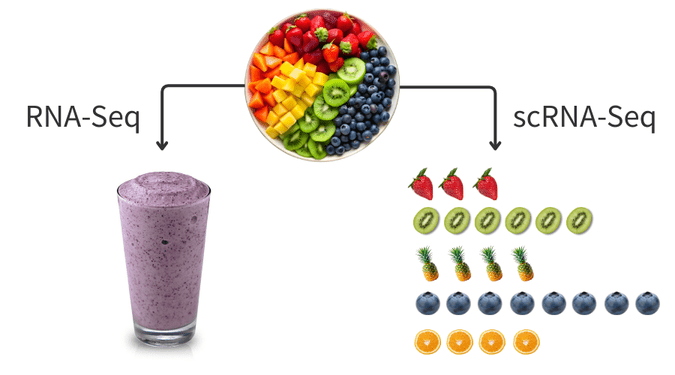
Bulk RNA-seq reports the average of mixed cells; single-cell RNA-seq shows differences among individual cells.
- Bulk RNA-seq pools RNA from an entire tissue and measures expression by sample.
- Single-cell RNA-seq gives each cell a barcode and measures its expression separately.
- Spatial transcriptomics measures expression together with location in the tissue.
Aggregating logs across an entire service shows the overall trend well, but an anomaly from one instance can disappear. Likewise, bulk RNA-seq can hide signals from a small cell population in the tissue average. Single-cell RNA-seq preserves cell-level differences, but its data is sparse and its cost and analytical complexity are higher.
You can inspect a real gene-by-sample bulk RNA-seq count table in the GSE251845 DEG exercise.
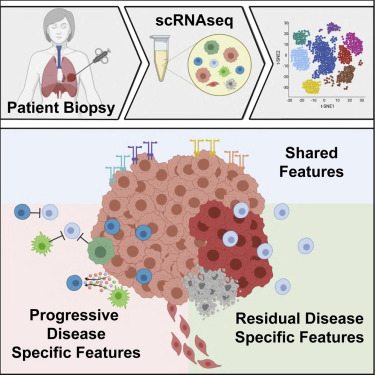
Single-cell RNA-seq can separate and observe a small population of drug-tolerant persister cells that survive treatment.
If the measurement unit is the cell, continue with What Is Single-Cell RNA Sequencing?. Single-cell RNA-seq lessons 1 through 8 cover the core experiment, barcodes and UMIs, count matrices, QC, clustering, annotation, and condition comparison.
3. Cost depends on sample count as well as scope
Section titled “3. Cost depends on sample count as well as scope”Costs rise as measurement scope widens, the same positions are read more deeply, and more time points are measured. The amounts below are historical quotes obtained from South Korean providers for one project, not current prices.
| Item | Quote at the time |
|---|---|
| Tumour WGS (100x) | KRW 1.65 million per sample |
| Normal/blood WGS (30x) | KRW 650,000 per sample |
| WES (200x) | KRW 300,000 per sample |
| Bulk RNA-seq | KRW 350,000 per sample |
| mRNA-seq | KRW 300,000 per sample |
| Bioinformatics analysis | KRW 100,000 per sample |
| Tissue RNA extraction and library preparation | Approximately KRW 500,000, optional |
Reading one sample deeply and obtaining multiple replicate samples solve different problems. Depth helps detect low-frequency signals within one sample, while replicates help separate individual variation from a condition effect.
Tissue condition is another design constraint. For tissue such as bone, from which cells are difficult to separate, available measurement methods and preprocessing may differ. Confirm the required sample condition with the analysis provider before collection.
Summary
Section titled “Summary”More data is not automatically better; the data must match the question. Decide whether to search broadly or inspect known positions deeply, and whether to measure a tissue average or separate a small cell population.
The next lesson, What Is Bulk RNA Sequencing?, follows the complete path from tissue RNA to a gene × sample matrix.
Sources
Section titled “Sources”- Drug-tolerant persister cells: Drug-tolerant persister cells in cancer, Nature Communications (2025)
Footnotes
Section titled “Footnotes”-
Probe: a short DNA fragment designed to bind complementarily to a specific region of interest. It acts as a filter that selects desired regions from the whole genome. ↩
-
Variant calling: an analysis that aligns reads to a reference genome and identifies positions where bases changed, were deleted, or were inserted. It resembles diffing against a reference and extracting changed locations. ↩
-
DPYD: a gene that produces an enzyme which breaks down drugs such as fluorouracil, or 5-FU. Certain variants increase the risk of severe toxicity at the same dose. ↩