EOCRC Exercise 4: Comparing Exon and Splice-Junction Usage
1. The input changes from gene counts to junctions
Section titled “1. The input changes from gene counts to junctions”One HTSeq gene-count row combines several transcripts from the same gene. Total HOTAIRM1 count can remain similar while the proportions of transcripts including and excluding exon 2 change.
This exercise does not reuse the count table from EOCRC Exercise 1. It uses BAM files and event-level outputs that preserve which exons and junctions each read supports.
| Input | Processing | Output |
|---|---|---|
| BAM, GTF | rMATS | Inclusion and skipping counts, PSI, and FDR by event |
| FASTQ or Whippet index | Whippet | PSI, delta PSI, and probability by node |
| Coordinates from both tools | Coordinate matching | Events detected by both methods |
2. Read one rMATS row
Section titled “2. Read one rMATS row”This simplified skipped-exon row is an illustrative example.
| gene | IJC_SAMPLE_1 | SJC_SAMPLE_1 | IncLevel1 | IncLevel2 | FDR | IncLevelDifference |
|---|---|---|---|---|---|---|
GENE_X | 41,38,45 | 9,12,8 | 0.81,0.76,0.83 | 0.34,0.39,0.31 | 0.002 | 0.45 |
IJC counts reads supporting inclusion junctions, while SJC counts reads supporting the skipping junction. IncLevel1 and IncLevel2 are percent-spliced-in (PSI) values for each group. In rMATS, IncLevelDifference is mean PSI in group 1 minus mean PSI in group 2.
PSI of 0.8 does not mean that exon is present in exactly 80% of transcripts in every cell. It is an event-level inclusion value normalized from read evidence in a mixed library.
Five common event types
Section titled “Five common event types”| rMATS name | Question |
|---|---|
SE | Was the middle exon included or skipped? |
A5SS | Which alternative 5′ splice site was used? |
A3SS | Which alternative 3′ splice site was used? |
MXE | Which of two mutually exclusive exons was selected? |
RI | Was the intron retained? |
3. Audit the 82 published final events
Section titled “3. Audit the 82 published final events”The paper filtered rMATS at FDR < 0.05, |delta PSI| > 0.1, and average tumour coverage over 20. It filtered Whippet at |delta PSI| > 0.1 and probability > 0.7, then published 82 events significant in both tools with matching coordinates in Supplementary Table S6.
The official supplementary package does not contain the original rMATS or Whippet event tables, patient-level PSI, or BAM files. The complete filtering and coordinate intersection therefore cannot be recomputed from public inputs alone. This exercise audits the 82 published final events and stops where raw tables become necessary.
Execution prompt: audit Supplementary Table S6
Audit the paper's public alternative-splicing results.

1. Download the official ZIP from the Europe PMC PMC11047122 supplementaryFiles API and record its URL, date, size, and SHA-256.
2. Open DataSheet_1.docx with python-docx and read its sixth table, Supplementary Table S6.
3. Preserve Gene name, Location, delta PSI, FDR, and Event type exactly and save outputs/paper-table-s6-82-splicing-events.csv.
4. Verify 82 rows, parse every Location as chromosome:strand:start:end, and validate numeric delta PSI and FDR.
5. Count event types and events with positive versus negative delta PSI.
6. Plot delta PSI against -log10(FDR) beside an event-type bar chart and save outputs/splicing-event-landscape.png.
7. Print the HOTAIRM1 coordinate, strand, delta PSI, FDR, and event type.
8. If the supplementary ZIP lacks raw rMATS and Whippet tables or patient-level PSI, do not construct a full intersection or patient PSI. Report the missing inputs and stop.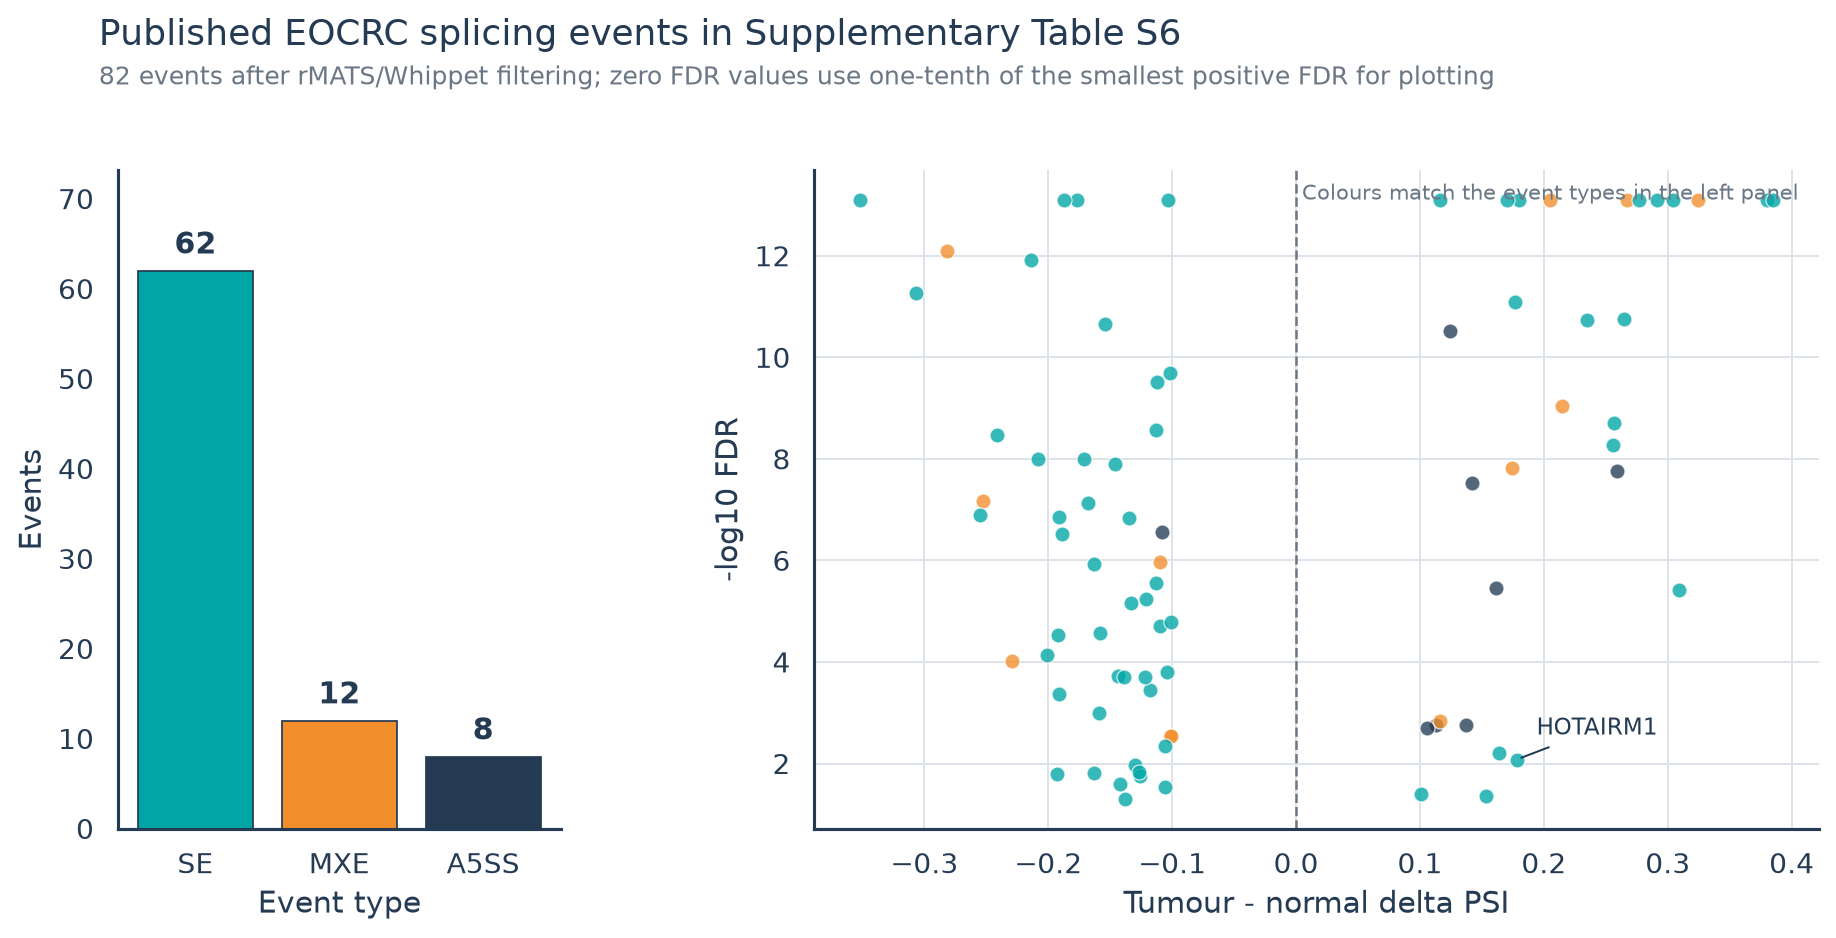
Actual run: 62 of the 82 events were SE, 12 MXE, and 8 A5SS. PSI increased in tumours for 31 events and decreased for 51. Colours identify the same event types in the left bars and right points.
An intersection does not prove the same truth twice. rMATS and Whippet represent and quantify events differently. Their intersection reduces candidates that depend on one tool’s representation and threshold, but does not establish the physical transcript structure.
4. Separate the HOTAIRM1 summary row from missing patient evidence
Section titled “4. Separate the HOTAIRM1 summary row from missing patient evidence”The paper presented higher HOTAIRM1 exon 2 inclusion in EOCRC tumours and lower inclusion in matched EOCRC normal tissue. Exon 2 inclusion was generally low in LOCRC.
Extension prompt: inspect patient-level HOTAIRM1 only with raw inputs
Start with the HOTAIRM1 summary row in Supplementary Table S6.

1. Print the public values: chr7, + strand, 27099097:27099366, delta PSI 0.178, FDR 0.00834, and SE.
2. Record that this row is a group-comparison summary, not patient-level PSI or junction counts.
3. Create a patient-condition long table, paired PSI plot, or Sashimi plot only when patient-level rMATS output or BAM files and indexes are separately available.
4. If those inputs are absent, do not reverse-engineer points from Figure 4G. Print the files required and stop.
Exon height in a Sashimi plot shows coverage and arcs show junction-supporting reads. PSI summarizes several junction counts as one inclusion value, so the same PSI can arise from different read depths and junction combinations.
5. Questions to answer
Section titled “5. Questions to answer”- Why can exon inclusion not be recovered from one gene-count row?
- What two values are subtracted in
IncLevelDifference=0.2? - Why is a coverage filter useful even when FDR is small?
- Why can rMATS and Whippet coordinates not be joined as raw strings?
- Why does agreement between two tools not establish the protein isoform?
The next EOCRC exercise extracts nucleotide sequence from tumour-enriched splicing events and converts it into 9-mer and MHC-I-binding candidates.
6. Sources and reproducibility
Section titled “6. Sources and reproducibility”- EOCRC paper
- Official rMATS-turbo repository and output definitions
- rMATS-turbo protocol
- Official Whippet repository and output definitions
Record genome build, GTF, read length, library type, rMATS and Whippet versions, filters, coordinate conversions, BAM pooling, and sample order.