EOCRC Exercise 2: Finding Functional and Cell-Composition Clues
1. What you will practice
Section titled “1. What you will practice”A list of gene names is difficult to interpret on its own. This exercise summarizes the results from EOCRC Exercise 1 in two ways.
| Input | Question | Output |
|---|---|---|
| EOCRC-specific candidate list | Which functions contain these candidates? | GO enrichment table |
| Expression matrix by sample | Which cell-type signatures are relatively strong? | xCell enrichment score by sample |
The first question groups genes by function. The second estimates the relative strength of immune and stromal cell signatures from a bulk RNA-seq mixture.
2. Keep the paper’s 48 candidates separate from the current reproduction
Section titled “2. Keep the paper’s 48 candidates separate from the current reproduction”The paper reported 48 genes with a more pronounced change in EOCRC. Twenty-two increased and 26 decreased. A subsequent paired Wilcoxon step narrowed these to the eight-gene signature.
outputs/eo-paper-like-candidates.csv from Exercise 1 is recalculated with the current PyDESeq2 version and current filters. It is not assumed to equal Supplementary Table S1. Under the unified criteria in Exercise 1, only MSLN among the eight published genes passed every boundary.
Over-representation analysis is not stable with only one or two candidates. This exercise therefore records two lists separately.
- The 48 published candidates, used to read the paper’s result
- The candidates from the current reproduction, used to audit what the current environment retains
3. GO enrichment of the 48 candidates
Section titled “3. GO enrichment of the 48 candidates”Step 1 prompt: the 48 candidates and GO enrichment
Keep the EOCRC Exercise 1 project and add only GO enrichment for the paper's 48 EOCRC-specific candidates.

1. Confirm that the current directory is the eocrc-locrc project and that outputs/eo-vs-lo-lfc-comparison.csv exists. If it is missing, do not fabricate a result. Report the missing file and stop.
2. Run uv add gprofiler-official and record the installed version.
3. Download Supplementary Table S1 from the publisher's official page for DOI 10.3389/fonc.2024.1365762. Verify that the file is supplied by the article publisher rather than a search result or secondary source.
4. Confirm that Supplementary Table S1 contains 48 EOCRC-specific candidates, with 22 upregulated and 26 downregulated. If not, report the columns and row counts and stop.
5. Record the source URL, download date, and SHA-256 in outputs/source-manifest.txt.
6. Run g:Profiler Homo sapiens GO Biological Process over-representation analysis separately for all 48, the 22 upregulated genes, and the 26 downregulated genes.
7. Use multiple-testing-adjusted results and preserve source, native term ID, term name, p_value, intersection_size, query_size, and intersection.
8. Save outputs/paper-48-go-all.csv, outputs/paper-48-go-up.csv, and outputs/paper-48-go-down.csv.
9. Do not merely list top terms. Check whether a small set of genes repeatedly creates several similar terms.
10. Also print the number of rows in outputs/eo-paper-like-candidates.csv. If it has fewer than five candidates, do not force a GO analysis and report that the list is too small.
11. Run uv run python analysis.py, keep the published and reproduced lists separate, explain the result, and stop.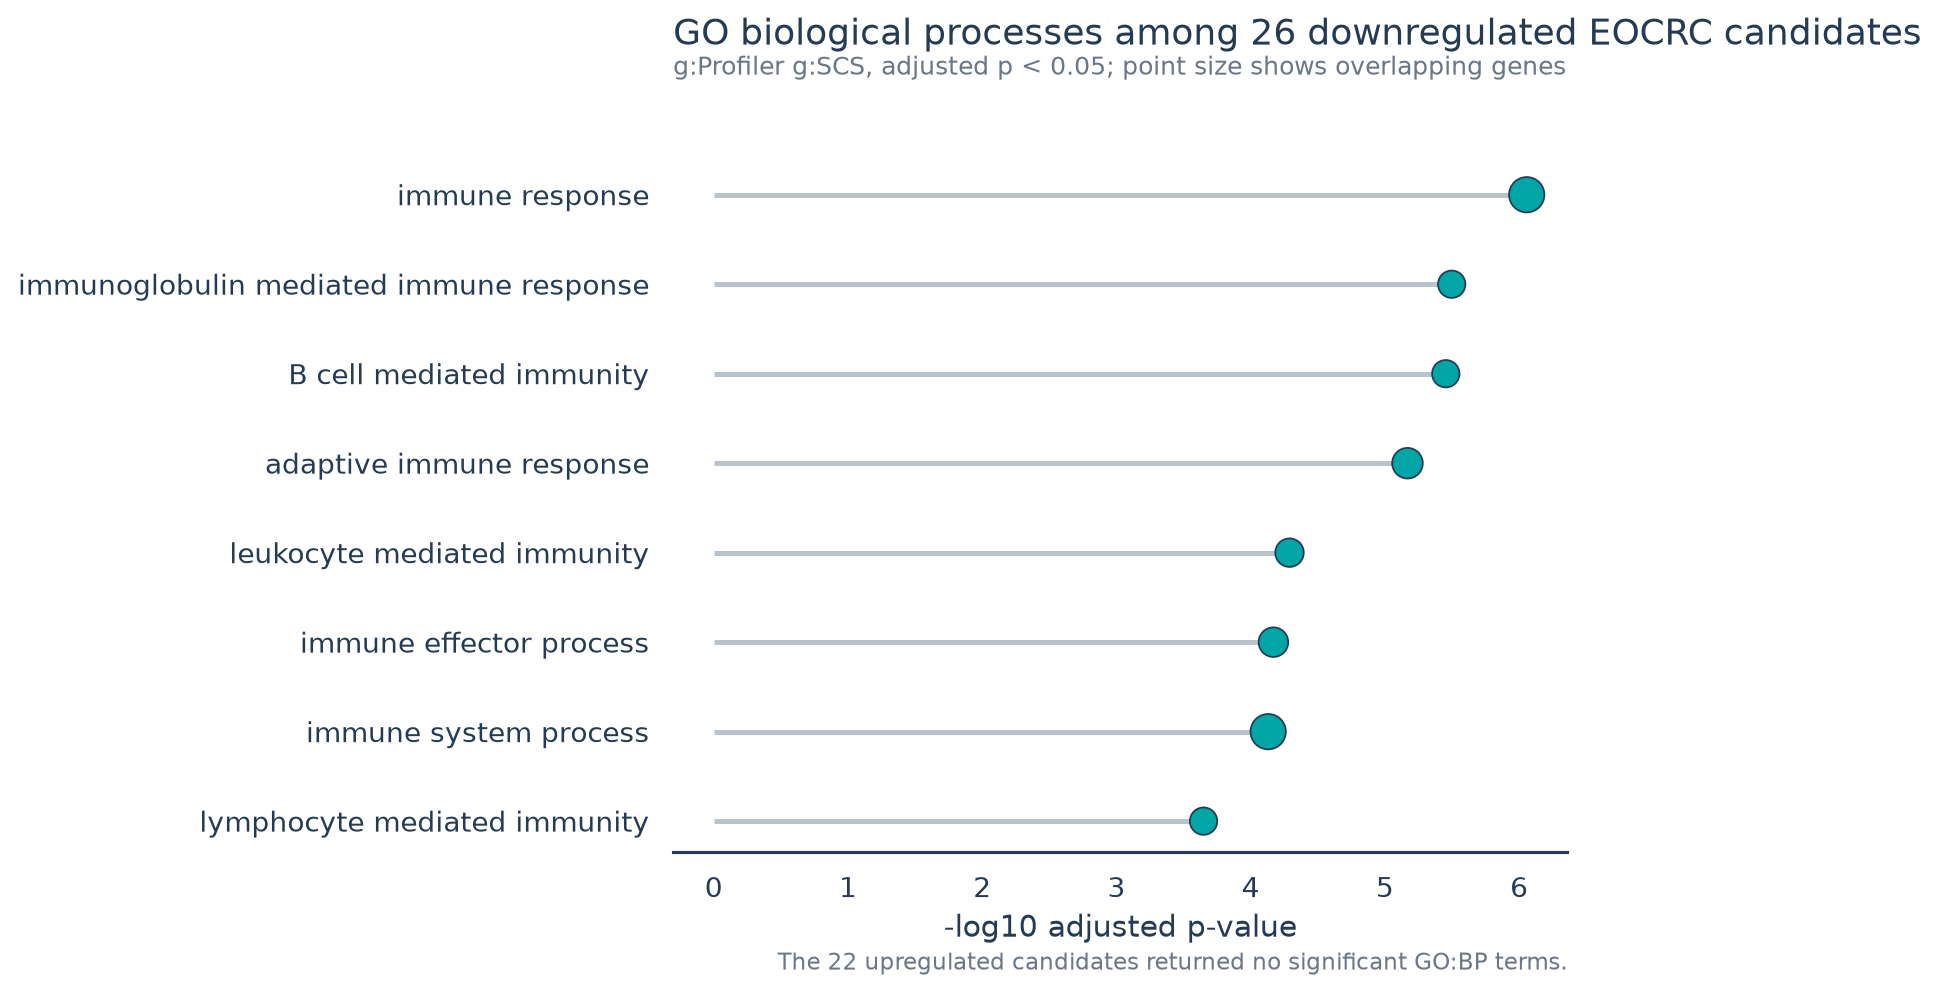
Actual run: the full 48-gene list returned nine significant GO Biological Process terms, and the same nine remained among the 26 downregulated candidates. The 22 upregulated candidates returned none. Several immune terms repeatedly share immunoglobulin genes, so they are not nine independent findings.
Several significant GO terms do not necessarily represent several independent findings. Terms such as T-cell activation, leukocyte adhesion, and immune response can share many genes. Inspect the intersection column to see which genes recur.
4. Audit the xCell input first
Section titled “4. Audit the xCell input first”xCell expects gene symbols in rows and samples in columns. Its official implementation requires gene-length-normalized RNA-seq expression and recommends processing the heterogeneous samples from one experiment together.
Do not relabel HTSeq raw counts or VST values from Exercise 1 as valid xCell input. If the exact gene lengths and annotation cannot be verified, label the run exploratory rather than a reproduction of the paper.
Step 2 prompt: audit xCell input and calculate scores
Keep the GO analysis and add an xCell input audit and score calculation.

1. Download official GEO raw counts for GSE196006 and GSE251845 and record URLs and SHA-256 checksums.
2. Calculate gene-level exon-union lengths from the GENCODE v50 GRCh38 GTF. Do not double-count overlapping exons, and record the annotation version.
3. Convert raw counts to gene-length-normalized TPM and map Ensembl IDs to gene symbols. Sum TPM for duplicate symbols, and remove blank or non-finite rows.
4. Verify that all 42 EOCRC and 44 LOCRC samples remain.
5. Install the official xCell 1.1.0 R package in a reproducible Bioconductor Docker environment and pass all 86 samples to xCellAnalysis together. Do not run Tumor and Normal separately.
6. Save the cell-type-by-sample matrix to outputs/xcell-scores.tsv.
7. Join metadata. Use paired comparisons within each cohort and Mann-Whitney U for 21 EOCRC versus 22 LOCRC tumours.
8. Apply Benjamini-Hochberg correction across all cell types and save outputs/xcell-tumour-comparisons.csv.
9. Do not call scores percentages, proportions, or observed cell counts.
10. Keep this exploratory rerun with current annotation and package separate from the paper's report, explain it, and stop.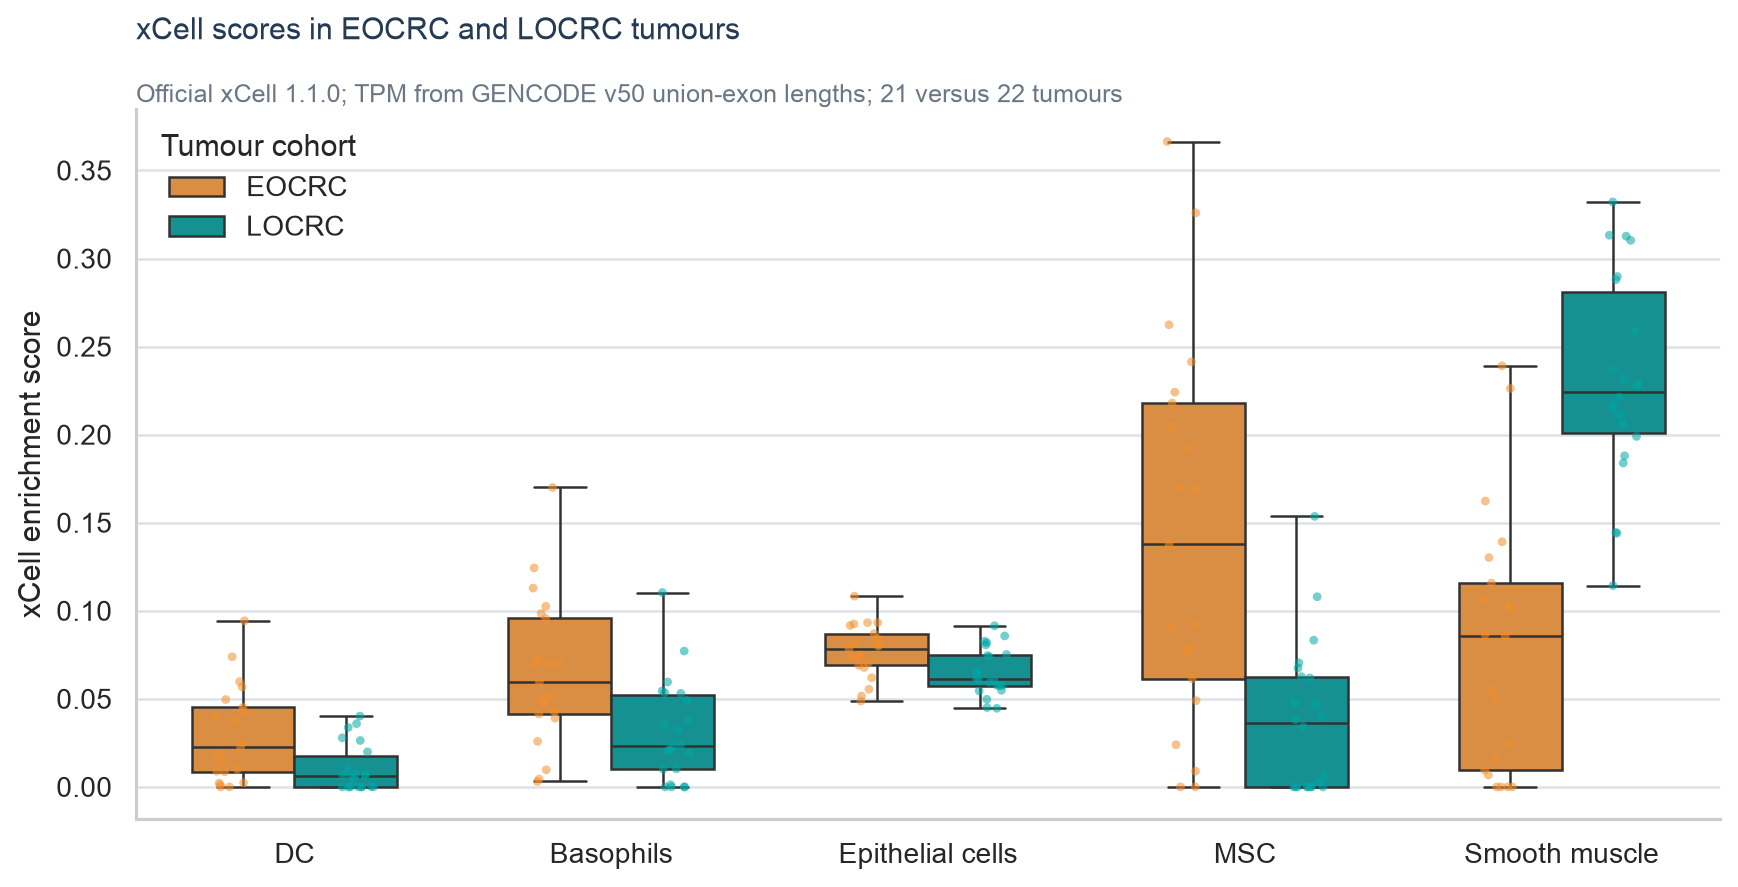
Actual run: raw counts were converted to TPM with GENCODE v50 exon-union lengths, then all 86 samples were processed together with official xCell 1.1.0. EOCRC tumours had higher MSC, basophil, and DC scores and lower smooth-muscle scores. BH-adjusted p-values across all cell types were 0.0090, 0.0420, 0.0486, and 0.000094, respectively. The epithelial-cell difference was not significant after correction (p=0.0797).
The comparison direction changes the question
Section titled “The comparison direction changes the question”| Comparison | Pairing | What it can show |
|---|---|---|
| EOCRC Tumor vs the same patient’s Normal | Paired | Did the signature change with the tumour? |
| LOCRC Tumor vs the same patient’s Normal | Paired | Did the later-onset group show the same change? |
| EOCRC Tumor vs LOCRC Tumor | Unpaired | Did tumour scores differ between patient groups? |
| Scores for different cell types | Do not compare directly | Cannot establish that one cell type is several times more abundant |
The study cohort showed several immune and stromal signature differences, but most were not reproduced in TCGA. This does not make xCell useless. It narrows the claim to signals that require independent replication and may depend on cohort or platform.
5. Questions to answer
Section titled “5. Questions to answer”- Why must the published 48-gene list remain separate from the reproduced candidates?
- Why can several similar GO terms arise from the same genes?
- How can xCell support sample comparisons if its score is not a proportion?
- Why is the Tumor-Normal test paired?
- How should a claim change when a study-cohort difference is not reproduced in TCGA?
The next EOCRC exercise combines eight-gene expression with follow-up time to build a Cox risk score and Kaplan-Meier curve.
6. Sources and reproducibility
Section titled “6. Sources and reproducibility”- EOCRC paper
- Official xCell repository and input guidance
- Original xCell paper
- g:Profiler APIs and official Python client
Record the supplementary URL and checksum, g:Profiler data version, xCell implementation and version, gene annotation, gene-length normalization, and statistical tests.